| |
| |
| Exchange: |
New York Stock Exchange |
| Security
Type: |
Mutual Fund |
| Shares
Out: |
39,772,000 |
| Market
Cap: |
313.40(M) |
| Last
Volume: |
156,749 |
Avg
Vol: |
222,516 |
| 52
Week Range: |
$7.64 - $7.94 |
|
| Level
I Sector: |
Financials |
| Level
II Sector: |
Financial Services |
| Level
III Sector: |
Closed - End Fund - Debt |
|
Member Indexes:
|
Rankings:
|
|
| Insider 3 Months : - |
| Insider 6 Months : - |
| Insider 3/6 Months : - |
|
| Guru Rank Number : - |
| Guru Rank Value : - |
| Guru Occurances : - |
|
|
|
|
|
| |
|
Company Profile Nuveen Floating Rate Income Opportunity Fund is a diversified closed-end management investment company. The Fund's investment objective is to achieve a high level of current income. The Fund invests at least 80% of its managed assets in adjustable rate loans, primarily secured senior loans. As part of the 80% requirement, the Fund also may invest in unsecured senior loans and secured and unsecured subordinated loans. The Fund invests at least 65% of its managed assets in adjustable rate senior loans that are secured by specific collateral.
|
|
|
D/I:
|
|
|
D
is for direct shares.
I is
for indirect shares.
D/I
refers to the Direct or Indirect
shares traded vs. held. |
|
|
|
Forms:
|
|
|
A
Form 4 is a form filed
by an insider to indicate a change
in ownership.
A Form
3 is a form filed by
an insider to indicate an
initial ownership of a security. |
|
|
|
3m +/-:
|
|
|
|
This
represents the company's 3 month
price change. The initial price
is based on the closing price
of the stock on the day the transaction
took place. Purchases & sales
are viewed as long & short
positions respectively.
|
|
|
|
Actions:
|
|
|
| B |
Buy |
| S |
Sell |
| OE |
Option
Exercised |
| A |
Acquired |
| D |
Disposed |
| AB |
Automatic
Buy |
| AS |
Automatic
Sell |
| IO |
Initial
Ownership |
|
|
|
|
Download:
|
|
|
Download only Transactions
Forms. (Default)
Download
only Summary Infomation.
Download
both Transactions and Summary Data
|
|
|
|
|
| |
| |
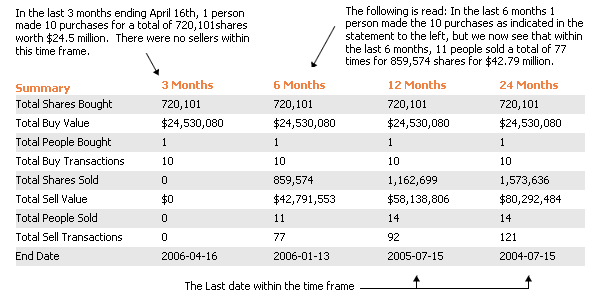
Summary (Direct Transactions Only)  |
3 Months |
6 Months |
12 Months |
24 Months |
| Total Shares Bought |
0 |
0 |
0 |
0 |
| Total Buy Value |
$0 |
$0 |
$0 |
$0 |
| Total People Bought |
0 |
0 |
0 |
0 |
| Total Buy Transactions |
0 |
0 |
0 |
0 |
| Total Shares Sold |
0 |
0 |
0 |
0 |
| Total Sell Value |
$0 |
$0 |
$0 |
$0 |
| Total People Sold |
0 |
0 |
0 |
0 |
| Total Sell Transactions |
0 |
0 |
0 |
0 |
| End Date |
2024-03-17 |
2023-12-15 |
2023-06-16 |
2022-06-16 |
|
| Filer's Name |
Relation Title |
Off-Dir-10% |
Tran. Date |
Form |
Action |
Price |
Mkt Value |
D/I |
Shares |
Holdings |
Rank
|
|
|
| 3m +/- |
|
|
Form |
  Caraher Scott C. Caraher Scott C. |
Portfolio Manager |
• • – |
2022-05-13 |
4 |
B |
$8.43 |
$42,162 |
D/D |
5,000 |
51,636 |
2.44 |
-4% |
|
| Caraher Scott C. |
Portfolio Manager |
• • – |
2022-02-25 |
4 |
B |
$9.70 |
$48,493 |
D/D |
5,000 |
46,636 |
2.44 |
-15% |
|
| Weinstein Boaz |
10% Owner |
– – • |
2021-05-12 |
4 |
S |
$9.53 |
$443,164 |
I/I |
(46,502) |
4,072,815 |
|
-3% |
|
| Weinstein Boaz |
10% Owner |
– – • |
2021-05-11 |
4 |
S |
$9.56 |
$56,328 |
I/I |
(5,892) |
4,119,317 |
|
-3% |
|
| Weinstein Boaz |
10% Owner |
– – • |
2021-05-10 |
4 |
S |
$9.61 |
$46,455 |
I/I |
(4,834) |
4,125,209 |
|
-4% |
|
| Weinstein Boaz |
10% Owner |
– – • |
2021-05-07 |
4 |
S |
$9.61 |
$9,677 |
I/I |
(1,007) |
4,130,043 |
|
-4% |
|
| Weinstein Boaz |
10% Owner |
– – • |
2021-05-06 |
4 |
S |
$9.60 |
$215,904 |
I/I |
(22,490) |
4,129,036 |
|
-3% |
|
| Weinstein Boaz |
10% Owner |
– – • |
2021-04-29 |
4 |
S |
$9.40 |
$20,219 |
I/I |
(2,151) |
4,153,540 |
|
-6% |
|
| Weinstein Boaz |
10% Owner |
– – • |
2021-04-28 |
4 |
S |
$9.41 |
$449,958 |
I/I |
(47,817) |
4,155,691 |
|
-5% |
|
| Weinstein Boaz |
10% Owner |
– – • |
2021-04-27 |
4 |
S |
$9.41 |
$344,058 |
I/I |
(36,563) |
4,203,508 |
|
-6% |
|
| Weinstein Boaz |
10% Owner |
– – • |
2021-04-23 |
4 |
S |
$9.46 |
$161,019 |
I/I |
(17,021) |
4,240,071 |
|
-6% |
|
| Weinstein Boaz |
10% Owner |
– – • |
2021-04-22 |
4 |
S |
$9.43 |
$55,637 |
I/I |
(5,900) |
4,257,092 |
|
-6% |
|
| Weinstein Boaz |
10% Owner |
– – • |
2021-04-21 |
4 |
S |
$9.45 |
$688,574 |
I/I |
(72,865) |
4,262,992 |
|
-5% |
|
| Weinstein Boaz |
10% Owner |
– – • |
2021-04-20 |
4 |
S |
$9.49 |
$155,076 |
I/I |
(16,341) |
4,335,857 |
|
-5% |
|
| Weinstein Boaz |
10% Owner |
– – • |
2021-04-19 |
4 |
S |
$9.52 |
$41,736 |
I/I |
(4,384) |
4,352,198 |
|
-3% |
|
| Weinstein Boaz |
10% Owner |
– – • |
2021-04-16 |
4 |
S |
$9.51 |
$409,263 |
I/I |
(43,035) |
4,356,582 |
|
-3% |
|
| Weinstein Boaz |
10% Owner |
– – • |
2021-04-15 |
4 |
S |
$9.51 |
$65,705 |
I/I |
(6,909) |
4,399,617 |
|
-3% |
|
| Weinstein Boaz |
10% Owner |
– – • |
2021-04-14 |
4 |
S |
$9.52 |
$212,905 |
I/I |
(22,364) |
4,406,526 |
|
-3% |
|
| Weinstein Boaz |
10% Owner |
– – • |
2021-04-13 |
4 |
S |
$9.55 |
$272,242 |
I/I |
(28,507) |
4,428,890 |
|
-2% |
|
| Weinstein Boaz |
10% Owner |
– – • |
2021-04-12 |
4 |
S |
$9.57 |
$114,438 |
I/I |
(11,958) |
4,457,397 |
|
-3% |
|
| Weinstein Boaz |
10% Owner |
– – • |
2021-04-09 |
4 |
S |
$9.59 |
$41,074 |
I/I |
(4,283) |
4,469,355 |
|
-3% |
|
| Weinstein Boaz |
10% Owner |
– – • |
2021-04-08 |
4 |
S |
$9.59 |
$189,575 |
I/I |
(19,768) |
4,473,638 |
|
-3% |
|
| Caraher Scott C. |
Portfolio Manager |
• • – |
2021-04-07 |
4 |
B |
$9.58 |
$47,900 |
D/D |
5,000 |
41,636 |
2.44 |
2% |
|
| Knights Of Columbus |
10% Owner |
– – • |
2020-11-09 |
4 |
S |
$100.00 |
$2,147,483,647 |
D/D |
(30,000,000) |
0 |
|
-15% |
|
| Toronto Dominion Bank |
|
– – • |
2020-11-05 |
3 |
IO |
$0.00 |
$0 |
D/D |
0 |
75,000 |
|
18% |
|
69 Records found
|
|
Page 1 of 3 |
|
|