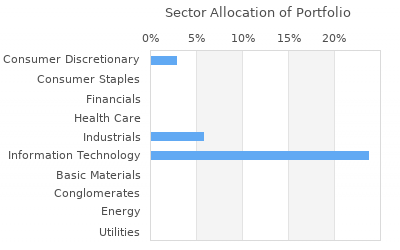
| |
|
|
| Name: |
Eliot Finkel Investment Counsel LLC |
| City: |
BEVERLY HILLS |
| State: |
CA |
| Zip: |
90212 |
| |
|
|
| Achive
data |
| View
Filing Period: |
|
|
|
|
|

|
 |
Download |
|
|
| |
| |
|
Free Registration Required For Full Results
|
|
|
| Holdings
Found :
30 |
|
View All Holdings |
Currently
Viewing:
ALL |
|
|
Page 1 of 1 |
Menu
 |
Ticker |
Company Name |
Position
Rank |
New/Closed
Postion |
Last
Close |
Value |
Shares Held |
% of
Portfolio |
Value
Change |
Change In
Shares Held |
% of Company |
Industry |


|
ETN |
Eaton Corp |
1 |
- |
$330.40 |
$14,815,000 |
47,380 |
9.57% |
3,051,000 |
-1,470 |
0.012 |
Diversified Machinery |


|
DE |
Deere & Co |
2 |
- |
$405.42 |
$9,591,000 |
23,350 |
6.2% |
82,000 |
-430 |
0.007 |
Farm & Construction M... |


|
PCAR |
Paccar Inc |
3 |
- |
$106.11 |
$9,102,000 |
73,471 |
5.88% |
1,710,000 |
-2,230 |
0.02 |
Trucks & Other Vehicles |


|
MRK |
Merck & Co Inc |
4 |
- |
$131.20 |
$8,768,000 |
66,450 |
5.66% |
1,347,000 |
-1,620 |
0.003 |
Drug Manufacturers - ... |


|
NSC |
Norfolk Southern Corp |
5 |
- |
$249.65 |
$8,714,000 |
34,190 |
5.63% |
431,000 |
-852 |
0.013 |
Railroads |


|
GD |
General Dynamics Corp |
6 |
- |
$292.74 |
$7,948,000 |
28,137 |
5.13% |
455,000 |
-720 |
0.01 |
Aerospace/Defense - M... |


|
ITW |
Illinois Tool Works Inc |
7 |
- |
$247.40 |
$7,555,000 |
28,155 |
4.88% |
61,000 |
-455 |
0.009 |
Diversified Machinery |


|
MSM |
MSC Industrial Direct Co Inc |
8 |
- |
$91.66 |
$7,552,000 |
77,824 |
4.88% |
-489,000 |
-1,590 |
0.17 |
Industrial Equipment ... |


|
AMGN |
Amgen Inc |
9 |
- |
$307.31 |
$7,455,000 |
26,222 |
4.82% |
-227,000 |
-450 |
0.004 |
Biotechnology |


|
MCD |
McDonalds Corp |
10 |
- |
$268.49 |
$6,898,000 |
24,465 |
4.46% |
-430,000 |
-250 |
0.003 |
Restaurants |


|
OMC |
Omnicom Group Inc |
11 |
- |
$95.07 |
$6,209,000 |
64,165 |
4.01% |
514,000 |
-1,660 |
0.03 |
Advertising Agencies |


|
APD |
Air Products & Chemicals Inc |
12 |
- |
$246.27 |
$5,805,000 |
23,960 |
3.75% |
-598,000 |
575 |
0.011 |
Diversified Chemicals |


|
UPS |
United Parcel Service Inc |
13 |
- |
$147.77 |
$5,646,000 |
37,985 |
3.65% |
-410,000 |
-530 |
0.005 |
AirDelivery & Freight... |


|
GLW |
Corning Inc |
14 |
- |
$33.93 |
$5,388,000 |
163,465 |
3.48% |
2,489,000 |
68,245 |
0.021 |
Communication Equipment |


|
AMAT |
Applied Materials Inc |
15 |
- |
$207.36 |
$5,081,000 |
24,637 |
3.28% |
877,000 |
-1,300 |
0.003 |
Semiconductor Equipme... |


|
DUK |
Duke Energy Corp |
16 |
- |
$102.38 |
$4,880,000 |
50,459 |
3.15% |
-104,000 |
-900 |
0.007 |
Electric Utilities |


|
USB |
US Bancorp Delaware |
17 |
- |
$41.69 |
$4,823,000 |
107,892 |
3.12% |
9,000 |
-3,348 |
0.007 |
Domestic Regional Banks |


|
MDT |
Medtronic Plc |
18 |
- |
$81.55 |
$4,822,000 |
55,330 |
3.12% |
1,193,000 |
11,273 |
0.004 |
Medical Appliances & ... |


|
LMT |
Lockheed Martin Corp |
19 |
- |
$466.16 |
$3,703,000 |
8,140 |
2.39% |
14,000 |
0 |
0.003 |
Aerospace/Defense - M... |


|
ADI |
Analog Devices Inc |
20 |
- |
$204.86 |
$3,168,000 |
16,015 |
2.05% |
-109,000 |
-490 |
0.003 |
Semiconductor- Broad... |


|
MCHP |
Microchip Technology Inc |
21 |
- |
$91.99 |
$2,816,000 |
31,395 |
1.82% |
-66,000 |
-560 |
0.006 |
Semiconductor - Speci... |


|
CHRW |
CH Robinson Worldwide Inc |
22 |
- |
$80.97 |
$2,764,000 |
36,300 |
1.79% |
-448,000 |
-880 |
0.027 |
AirDelivery & Freight... |


|
AEP |
American Electric Power Co Inc |
23 |
- |
$90.58 |
$2,683,000 |
31,164 |
1.73% |
28,000 |
-1,520 |
0.006 |
Electric Utilities |


|
CSCO |
Cisco Systems Inc |
24 |
- |
$48.00 |
$2,234,000 |
44,770 |
1.44% |
-110,000 |
-1,620 |
0.001 |
Networking & Communic... |


|
STAG |
Stag Industrial, Inc. |
25 |
- |
$34.98 |
$2,198,000 |
57,170 |
1.42% |
-137,000 |
-2,310 |
0.033 |
REIT - Industrial |


|
PEP |
Pepsico Inc |
26 |
- |
$177.41 |
$1,487,000 |
8,495 |
0.96% |
-24,000 |
-400 |
0.001 |
Beverage Soft Drinks... |


|
AAPL |
Apple Inc |
27 |
- |
$182.74 |
$1,383,000 |
8,066 |
0.89% |
-170,000 |
0 |
0 |
Personal Computers |


|
RTX |
RTX Corp |
28 |
- |
$101.02 |
$959,000 |
9,833 |
0.62% |
132,000 |
0 |
0.001 |
Conglomerates |


|
SPY |
Standard & Poors Depository... |
29 |
- |
$517.19 |
$337,000 |
645 |
0.22% |
30,000 |
0 |
0 |
Closed - End Fund - E... |


|
IFF |
International Flavors & Fra... |
30 |
Closed |
$97.23 |
$0 |
0 |
0% |
-3,148,000 |
-38,875 |
0 |
Specialty Chemicals |
|


