| |
Institutional
Holders
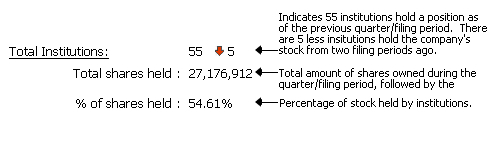
Total
Institutions:
 |
120  13 13 |
|
|
Total
shares held :
|
16,698,266 |
|
|
% of shares
held :
|
18.55% |
|
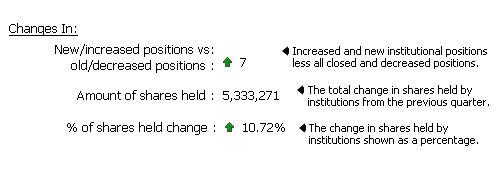
| Changes In:
|
|
|
|
New/increased
positions vs
old/decreased
positions :
|
-12 |
|
|
Amount
of shares held :
|
-7,553,887 |
|
|
% of shares
held change :
|
-8.39% |
|
| Quarter
Price vs. Current Price:
|
|
|
Quarter Price vs.
Current Price:
|
|
|
|
|
|
|
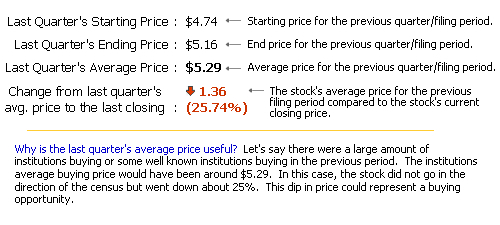
Last
Quarter's Starting
Price :
|
$25.82 |
|
|
Last
Quarter's Ending
Price :
|
$28.68 |
|
|
Last
Quarter's Average
Price :
|
$27.00 |
|
|
Change
from last quarter's
avg. price
to the last closing :
|
|
|
 2.21 (8.19%) 2.21 (8.19%) |
|
|
|

|

|


|
|
|

|
Free Registration Required For Full Results
|
Institution Name |
Portfolio
Position |
New/Closed
Position |
Filing Date |
Total Shares |
Total Value |
Change in Shares |
File |
  Miracle Mile Advisors LLC Miracle Mile Advisors LLC |
18 |
- |
2024-03-31 |
2,225,703 |
$63,833,000 |
-25,323 |
|
| LITMAN GREGORY ASSET MANAGEMENT LLC |
12 |
- |
2024-03-31 |
777,024 |
$22,285,000 |
-10,595 |
|
| MORGAN STANLEY |
2938 |
- |
2024-03-31 |
537,604 |
$15,419,000 |
-36,313 |
|
| Resources Investment Advisors Inc. |
106 |
- |
2024-03-31 |
437,198 |
$12,539,000 |
-24,217 |
|
| Advisor Group Holdings Inc. |
723 |
- |
2024-03-31 |
325,480 |
$9,335,000 |
-94,641 |
|
| CAMBRIDGE INVESTMENT RESEARCH ADVISORS INC |
645 |
- |
2024-03-31 |
212,054 |
$6,082,000 |
-6,013 |
|
| RAYMOND JAMES FINANCIAL SERVICES ADVISORS, INC. |
1089 |
- |
2024-03-31 |
186,587 |
$5,351,000 |
-49,196 |
|
| Retirement Network |
22 |
- |
2024-03-31 |
184,763 |
$5,299,000 |
-9,723 |
|
| CSS LLC/IL |
18 |
- |
2024-03-31 |
128,864 |
$3,696,000 |
-5,000 |
|
| Cambria Investment Management L.P. |
120 |
- |
2024-03-31 |
121,906 |
$3,496,000 |
-26,866 |
|
| CoreCap Advisors LLC |
112 |
- |
2023-12-31 |
111,661 |
$2,876,000 |
-64,643 |
|
| FINANCIAL NETWORK |
904 |
- |
2024-03-31 |
90,629 |
$2,599,000 |
-96,774 |
|
| E&G Advisors LP |
25 |
- |
2024-03-31 |
85,587 |
$2,455,000 |
-275 |
|
| Fermata Advisors LLC |
44 |
- |
2024-03-31 |
84,070 |
$2,411,000 |
-26,864 |
|
| Sowell Financial Services LLC |
225 |
- |
2024-03-31 |
73,206 |
$2,100,000 |
-33,483 |
|
| MML INVESTORS SERVICES LLC |
1075 |
- |
2024-03-31 |
64,277 |
$1,843,000 |
-5,303 |
|
| Rockefeller Capital Management L.P. |
1063 |
- |
2024-03-31 |
60,830 |
$1,745,000 |
-5,519 |
|
| IFP Advisors Inc |
268 |
- |
2023-12-31 |
66,403 |
$1,711,000 |
-1,944 |
|
| MARINER WEALTH ADVISORS, LLC |
1266 |
- |
2024-03-31 |
51,174 |
$1,468,000 |
-7 |
|
| STERNECK CAPITAL MANAGEMENT, LLC |
31 |
- |
2024-03-31 |
47,420 |
$1,360,000 |
-285 |
|
| Twelve Points Wealth Management LLC |
63 |
- |
2024-03-31 |
37,678 |
$1,081,000 |
-6,667 |
|
| Canal Capital Management LLC |
77 |
- |
2024-03-31 |
33,862 |
$971,000 |
-61,308 |
|
| WEALTH ENHANCEMENT ADVISORY SERVICES LLC |
1312 |
- |
2024-03-31 |
29,096 |
$834,000 |
-17,589 |
|
| ADVISORY SERVICES NETWORK, LLC |
788 |
- |
2024-03-31 |
26,803 |
$769,000 |
-2,350 |
|
| Cedar Brook Financial Partners LLC |
165 |
- |
2024-03-31 |
23,885 |
$685,000 |
-34,287 |
|
| J2 Capital Management Inc |
25 |
- |
2023-09-30 |
21,871 |
$632,000 |
-1,544 |
|
| Verum Partners LLC |
69 |
- |
2024-03-31 |
21,660 |
$621,000 |
-1,246 |
|
| Creekmur Asset Management LLC |
59 |
- |
2024-03-31 |
21,449 |
$615,000 |
-40,564 |
|
| RETIREMENT FINANCIAL SOLUTIONS LLC |
27 |
- |
2024-03-31 |
21,015 |
$603,000 |
-3,141 |
|
| Financial Advocates Investment Management |
431 |
- |
2024-03-31 |
19,336 |
$555,000 |
-7,243 |
|
| Ethos Financial Group LLC |
129 |
- |
2024-03-31 |
18,851 |
$539,000 |
-3,578 |
|
| Retirement Group LLC |
71 |
- |
2024-03-31 |
17,600 |
$505,000 |
-3,000 |
|
| Trilogy Capital Inc. |
208 |
- |
2024-03-31 |
15,398 |
$442,000 |
-18,111 |
|
| FIRST HEARTLAND CONSULTANTS INC |
314 |
- |
2024-03-31 |
11,780 |
$338,000 |
-6,921 |
|
| Steward Partners Investment Advisory LLC |
1290 |
- |
2024-03-31 |
9,654 |
$277,000 |
-4,167 |
|
| Kestra Advisory Services LLC |
2066 |
- |
2024-03-31 |
9,270 |
$266,000 |
-4,053 |
|
| LINCOLN NATIONAL CORP |
1031 |
- |
2024-03-31 |
8,512 |
$244,000 |
-2,487 |
|
| Goss Wealth Management LLC |
1768 |
- |
2024-03-31 |
7,886 |
$226,000 |
-1,009 |
|
| STEWARD PARTNERS INVESTMENT SOLUTIONS LLC |
239 |
- |
2024-03-31 |
7,500 |
$215,000 |
-5,965 |
|
| COMERICA BANK |
2404 |
- |
2024-03-31 |
5,158 |
$148,000 |
-17 |
|
| WELLS FARGO & CO/MN |
4123 |
- |
2024-03-31 |
5,000 |
$143,000 |
-1,372 |
|
| Johnson Midwest Financial LLC |
75 |
- |
2023-09-30 |
2,216 |
$64,000 |
-2 |
|
| Householder Group Estate & Retirement Specialist L |
485 |
- |
2024-03-31 |
1,615 |
$46,000 |
-217 |
|
| Sound Income Strategies LLC |
509 |
- |
2024-03-31 |
1,076 |
$31,000 |
-28 |
|
| PROEQUITIES INC. |
1471 |
- |
2024-03-31 |
800 |
$23,000 |
-3,500 |
|
| WFA of San Diego LLC |
248 |
- |
2023-09-30 |
598 |
$17,000 |
-150 |
|
| Legend Financial Advisors Inc. |
180 |
- |
2024-03-31 |
25 |
$1,000 |
-35 |
|
|
47 Records found
|
1
|
Page 1 of 1 |
|
Download: (Current
Quarter Only)
|
|
|
Download only Institutional Holders.
(Default)
Download only
Summary Infomation.
Download
both Summary and Institutional Data
|
|
|
|
Free Registration Required For Full Results
|
|
|