| |
Institutional
Holders
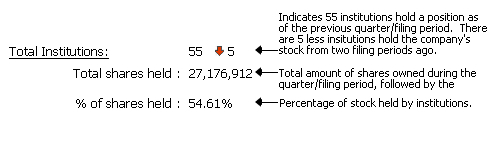
Total
Institutions:
 |
101  6 6 |
|
|
Total
shares held :
|
89,145,947 |
|
|
% of shares
held :
|
42.27% |
|
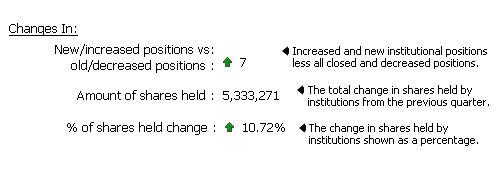
| Changes In:
|
|
|
|
New/increased
positions vs
old/decreased
positions :
|
22 |
|
|
Amount
of shares held :
|
2,614,653 |
|
|
% of shares
held change :
|
1.24% |
|
| Quarter
Price vs. Current Price:
|
|
|
Quarter Price vs.
Current Price:
|
|
|
|
|
|
|
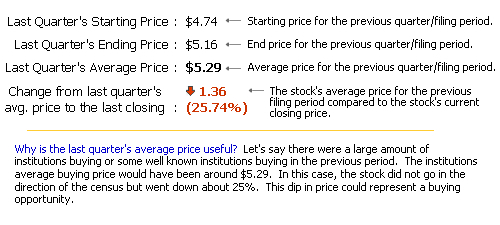
Last
Quarter's Starting
Price :
|
N/A |
|
|
Last
Quarter's Ending
Price :
|
N/A |
|
|
Last
Quarter's Average
Price :
|
N/A |
|
|
Change
from last quarter's
avg. price
to the last closing :
|
|
|
|
(%) |
|
|
|
|

|
|
| All
Securities Held : |
Positions
|
Shares
|
%
Of
Total Shares
|
|
|
New
Positions : |
17
|
2,861,383
|
3.21%
|
|
 |
Increased
Positions : |
41
|
9,278,002
|
10.41%
|
|
|
|
Unchanged
Positions : |
18
|
39,259,209
|
44.04%
|
|
|
|
Decreased
Positions : |
25
|
-6,658,198
|
-7.47%
|
|
|
|
Closed
Positions : |
11
|
-2,866,534
|
-3.22%
|
|
|
|
Guru
Positions : |
1
|
0
|
0%
|
|
|

|
Free Registration Required For Full Results
|
Institution Name |
Portfolio
Position |
New/Closed
Position |
Filing Date |
Total Shares |
Total Value |
Change in Shares |
File |
  WELLINGTON MANAGEMENT CO LLP WELLINGTON MANAGEMENT CO LLP |
607 |
- |
2024-03-31 |
17,195,933 |
$76,350,000 |
1,428,252 |
|
| Phoenix Holdings Ltd. |
54 |
- |
2024-03-31 |
6,315,777 |
$28,050,000 |
1,096,000 |
|
| Migdal Insurance & Financial Holdings Ltd. |
52 |
- |
2024-03-31 |
5,927,178 |
$26,317,000 |
1,883,943 |
|
| MENORA MIVTACHIM HOLDINGS LTD. |
61 |
- |
2024-03-31 |
3,599,318 |
$15,981,000 |
1,749,318 |
|
| MARSHALL WACE LLP |
737 |
- |
2024-03-31 |
1,624,605 |
$7,213,000 |
1,371,025 |
|
| Connor Clark & Lunn Investment Management Ltd. |
391 |
- |
2024-03-31 |
1,378,724 |
$6,122,000 |
225,899 |
|
| BLACKROCK INC. |
3498 |
- |
2024-03-31 |
1,111,969 |
$4,937,000 |
563,325 |
|
| Checchi Capital Advisers LLC |
66 |
- |
2024-03-31 |
1,069,944 |
$4,751,000 |
297,411 |
|
| MORGAN STANLEY |
3867 |
- |
2024-03-31 |
1,064,501 |
$4,726,000 |
957,624 |
|
| Yarra Square Partners LP |
11 |
- |
2024-03-31 |
1,049,485 |
$4,660,000 |
65,000 |
|
| MILLENNIUM MANAGEMENT LLC |
1946 |
- |
2024-03-31 |
1,012,469 |
$4,495,000 |
399,159 |
|
| SCHWAB CHARLES INVESTMENT MANAGEMENT INC |
2362 |
- |
2024-03-31 |
906,552 |
$4,025,000 |
11,039 |
|
| LEVIN CAPITAL STRATEGIES LP |
50 |
- |
2024-03-31 |
884,104 |
$3,925,000 |
622,614 |
|
| ACADIAN ASSET MANAGEMENT LLC |
581 |
- |
2024-03-31 |
671,712 |
$2,977,000 |
569,663 |
|
| VANGUARD GROUP INC |
3472 |
- |
2024-03-31 |
660,112 |
$2,931,000 |
17,216 |
|
| ARK Investment Management LLC |
158 |
- |
2024-03-31 |
527,364 |
$2,341,000 |
3,752 |
|
| CITADEL ADVISORS LLC |
2326 |
- |
2024-03-31 |
492,804 |
$2,188,000 |
214,806 |
|
| Altshuler Shaham Ltd |
23 |
- |
2024-03-31 |
654,373 |
$2,184,000 |
90,000 |
|
| TWO SIGMA INVESTMENTS LLC |
1487 |
- |
2024-03-31 |
388,926 |
$1,727,000 |
238,528 |
|
| Intellectus Partners LLC |
65 |
- |
2024-03-31 |
380,668 |
$1,690,000 |
24,000 |
|
| J P MORGAN CHASE & CO |
3091 |
- |
2024-03-31 |
367,725 |
$1,633,000 |
152,824 |
|
| GEODE CAPITAL MANAGEMENT LLC |
3248 |
- |
2024-03-31 |
303,211 |
$1,346,000 |
19,438 |
|
| COMMONWEALTH EQUITY SERVICES LLC. |
2117 |
- |
2024-03-31 |
258,500 |
$1,148,000 |
43,936 |
|
| Cubist Systematic Strategies LLC |
1173 |
- |
2024-03-31 |
212,903 |
$945,000 |
41,290 |
|
| SIMPLEX TRADING LLC |
531 |
- |
2024-03-31 |
171,970 |
$763,000 |
56,299 |
|
| ETF MANAGERS GROUP LLC |
331 |
- |
2023-03-31 |
245,240 |
$667,000 |
245,240 |
|
| JANE STREET GROUP LLC |
3720 |
- |
2024-03-31 |
127,377 |
$566,000 |
104,684 |
|
| CALIFORNIA STATE TEACHERS RETIREMENT SYSTEM |
2108 |
- |
2024-03-31 |
121,780 |
$541,000 |
1,123 |
|
| PDT PARTNERS, LLC |
451 |
- |
2024-03-31 |
112,176 |
$498,000 |
76,769 |
|
| Nebula Research & Development LLC |
416 |
- |
2024-03-31 |
95,378 |
$423,000 |
24,006 |
|
| BARCLAYS PLC |
2957 |
- |
2024-03-31 |
75,246 |
$334,000 |
138 |
|
| VAN ECK ASSOCIATES CORP |
1118 |
- |
2024-03-31 |
65,500 |
$291,000 |
2,932 |
|
| HARBOR CAPITAL ADVISORS INC. |
540 |
- |
2024-03-31 |
62,308 |
$277,000 |
33,982 |
|
| GROUP ONE TRADING, L.P. |
591 |
- |
2024-03-31 |
61,518 |
$273,000 |
4,150 |
|
| MEITAV DASH INVESTMENTS LTD |
205 |
- |
2024-03-31 |
61,000 |
$271,000 |
5,000 |
|
| Hennion & Walsh Asset Management Inc. |
720 |
- |
2024-03-31 |
60,701 |
$270,000 |
4,478 |
|
| TOWER RESEARCH CAPITAL LLC |
1428 |
- |
2024-03-31 |
43,192 |
$192,000 |
40,698 |
|
| Squarepoint Ops LLC |
2096 |
- |
2024-03-31 |
43,010 |
$191,000 |
10,230 |
|
| UBS Group AG |
4894 |
- |
2024-03-31 |
31,236 |
$139,000 |
6,414 |
|
| Counterpoint Mutual Funds LLC |
145 |
- |
2024-03-31 |
30,798 |
$137,000 |
8,079 |
|
| Pictet Asset Management Holding SA |
1840 |
- |
2024-03-31 |
29,952 |
$133,000 |
15,757 |
|
| AMERICAN CENTURY COMPANIES INC |
2758 |
- |
2024-03-31 |
27,992 |
$124,000 |
12,069 |
|
| GRAHAM CAPITAL MANAGEMENT LP |
931 |
- |
2024-03-31 |
19,576 |
$87,000 |
1,664 |
|
| ALLIANCEBERNSTEIN L.P. |
3044 |
- |
2024-03-31 |
17,000 |
$75,000 |
17,000 |
|
|
44 Records found
|
1
|
Page 1 of 1 |
|
Download: (Current
Quarter Only)
|
|
|
Download only Institutional Holders.
(Default)
Download only
Summary Infomation.
Download
both Summary and Institutional Data
|
|
|
|
Free Registration Required For Full Results
|
|
|