| |
Institutional
Holders
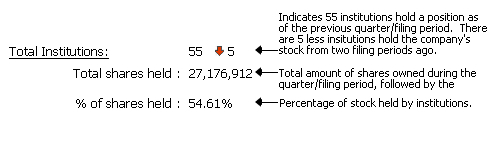
Total
Institutions:
 |
62  1 1 |
|
|
Total
shares held :
|
60,918,570 |
|
|
% of shares
held :
|
76.23% |
|
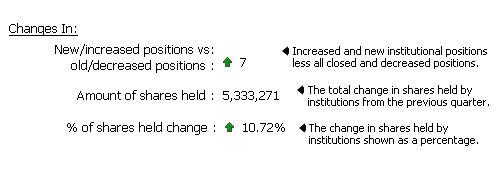
| Changes In:
|
|
|
|
New/increased
positions vs
old/decreased
positions :
|
-8 |
|
|
Amount
of shares held :
|
-93,637 |
|
|
% of shares
held change :
|
-0.12% |
|
| Quarter
Price vs. Current Price:
|
|
|
Quarter Price vs.
Current Price:
|
|
|
|
|
|
|
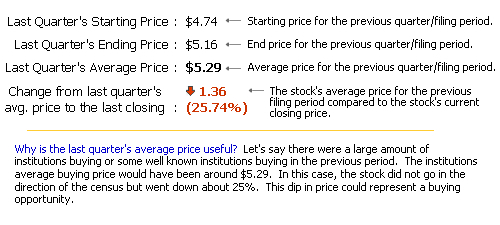
Last
Quarter's Starting
Price :
|
$14.77 |
|
|
Last
Quarter's Ending
Price :
|
$20.58 |
|
|
Last
Quarter's Average
Price :
|
$15.99 |
|
|
Change
from last quarter's
avg. price
to the last closing :
|
|
|
 3.65 (22.83%) 3.65 (22.83%) |
|
|
|

|

|


|
|
|

|
Free Registration Required For Full Results
|
Institution Name |
Portfolio
Position |
New/Closed
Position |
Filing Date |
Total Shares |
Total Value |
Change in Shares |
File |
  PCJ INVESTMENT COUNSEL LTD. PCJ INVESTMENT COUNSEL LTD. |
11 |
*New |
2023-12-31 |
334,267 |
$6,892,000 |
334,267 |
|
| K2 PRINCIPAL FUND L.P. |
25 |
*New |
2023-12-31 |
98,800 |
$2,033,000 |
98,800 |
|
| Triasima Portfolio Management inc. |
100 |
*New |
2024-03-31 |
63,415 |
$1,405,000 |
63,415 |
|
| JANE STREET GROUP LLC |
4739 |
*New |
2023-12-31 |
9,853 |
$203,000 |
9,853 |
|
| ING INVESTMENT MANAGEMENT, INC. |
253 |
*New |
2024-03-31 |
4,960 |
$110,000 |
4,960 |
|
| Lynwood Capital Management Inc. |
24 |
*New |
2023-12-31 |
3,000 |
$62,000 |
3,000 |
|
| Stone House Investment Management LLC |
263 |
*New |
2023-12-31 |
103 |
$2,000 |
103 |
|
|
7 Records found
|
1
|
Page 1 of 1 |
|
Download: (Current
Quarter Only)
|
|
|
Download only Institutional Holders.
(Default)
Download only
Summary Infomation.
Download
both Summary and Institutional Data
|
|
|
|
Free Registration Required For Full Results
|
|
|