| |
Institutional
Holders
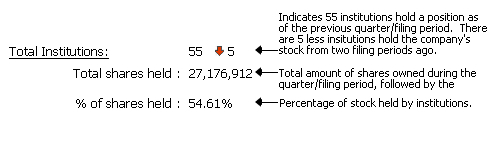
Total
Institutions:
 |
46  4 4 |
|
|
Total
shares held :
|
21,562,157 |
|
|
% of shares
held :
|
23.96% |
|
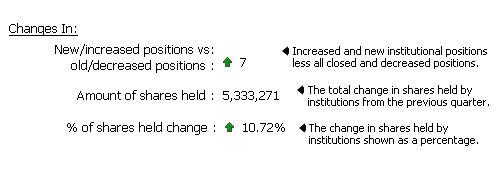
| Changes In:
|
|
|
|
New/increased
positions vs
old/decreased
positions :
|
-4 |
|
|
Amount
of shares held :
|
-855,596 |
|
|
% of shares
held change :
|
-0.95% |
|
| Quarter
Price vs. Current Price:
|
|
|
Quarter Price vs.
Current Price:
|
|
|
|
|
|
|
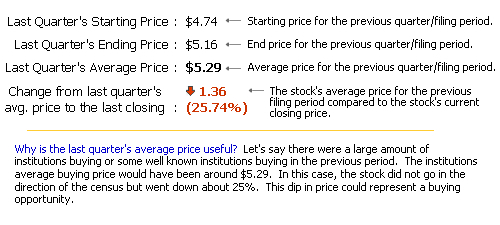
Last
Quarter's Starting
Price :
|
N/A |
|
|
Last
Quarter's Ending
Price :
|
N/A |
|
|
Last
Quarter's Average
Price :
|
N/A |
|
|
Change
from last quarter's
avg. price
to the last closing :
|
|
|
|
(%) |
|
|
|
|

|
|
|
|
Charting Not Avaliable |
Free Registration Required For Full Results
|
Institution Name |
Portfolio
Position |
New/Closed
Position |
Filing Date |
Total Shares |
Total Value |
Change in Shares |
File |
  Sandia Investment Management LP Sandia Investment Management LP |
96 |
- |
2023-12-31 |
2,035,568 |
$102,000 |
-288,164 |
|
| Shaolin Capital Management LLC |
227 |
- |
2023-12-31 |
192,312 |
$10,000 |
-52,542 |
|
| FLOW TRADERS U.S. LLC |
718 |
- |
2023-12-31 |
26,599 |
$1,000 |
-4,614 |
|
|
3 Records found
|
1
|
Page 1 of 1 |
|
Download: (Current
Quarter Only)
|
|
|
Download only Institutional Holders.
(Default)
Download only
Summary Infomation.
Download
both Summary and Institutional Data
|
|
|
|
Free Registration Required For Full Results
|
|
|