| |
Institutional
Holders
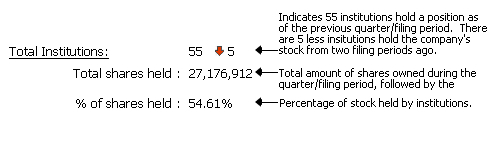
Total
Institutions:
 |
180  5 5 |
|
|
Total
shares held :
|
79,315,267 |
|
|
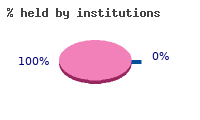
% of shares
held :
|
55.68% |
|
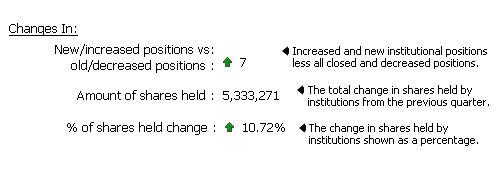
| Changes In:
|
|
|
|
New/increased
positions vs
old/decreased
positions :
|
 12 12 |
|
|
Amount
of shares held :
|
-1,965,395 |
|
|
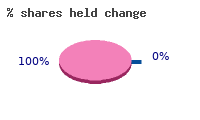
% of shares
held change :
|
-1.38% |
|
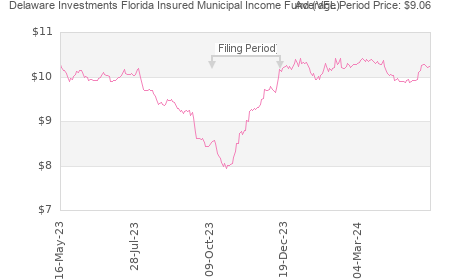
| Quarter
Price vs. Current Price:
|
|
|
Quarter Price vs.
Current Price:
|
|
|
|
|
|
|
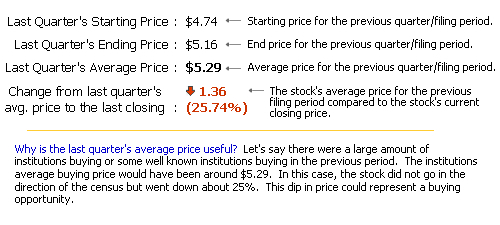
Last
Quarter's Starting
Price :
|
N/A |
|
|
Last
Quarter's Ending
Price :
|
N/A |
|
|
Last
Quarter's Average
Price :
|
N/A |
|
|
Change
from last quarter's
avg. price
to the last closing :
|
|
|
|
(%) |
|
|
|
|

|
|
| All
Securities Held : |
Positions
|
Shares
|
%
Of
Total Shares
|
|
|
New
Positions : |
14
|
492,240
|
0.62%
|
|
|
|
Increased
Positions : |
65
|
6,335,163
|
7.99%
|
|
|
|
Unchanged
Positions : |
53
|
13,920,402
|
17.55%
|
|
 |
Decreased
Positions : |
48
|
-5,755,967
|
-7.26%
|
|
|
|
Closed
Positions : |
19
|
-3,036,831
|
-3.83%
|
|
|
|
Guru
Positions : |
1
|
200,000
|
0.25%
|
|
|
|
Free Registration Required For Full Results
|
Institution Name |
Portfolio
Position |
New/Closed
Position |
Filing Date |
Total Shares |
Total Value |
Change in Shares |
File |
  G2 Investment Partners Management LLC G2 Investment Partners Management LLC |
7 |
- |
2023-12-31 |
2,018,847 |
$9,529,000 |
-40,618 |
|
| RIMA MANAGEMENT LLC |
38 |
- |
2023-12-31 |
1,518,112 |
$7,165,000 |
-287,978 |
|
| UBS OCONNOR LLC |
62 |
- |
2023-12-31 |
956,623 |
$4,515,000 |
-429,988 |
|
| Yost Capital Management L.L.C. |
7 |
- |
2023-12-31 |
743,500 |
$3,509,000 |
-45,000 |
|
| TWO SIGMA INVESTMENTS LLC |
1178 |
- |
2023-12-31 |
606,307 |
$2,862,000 |
-405,404 |
|
| MORGAN STANLEY |
4220 |
- |
2023-12-31 |
575,442 |
$2,716,000 |
-17,064 |
|
| NUVEEN ASSET MANAGEMENT, LLC |
2264 |
- |
2023-12-31 |
560,741 |
$2,647,000 |
-188,803 |
|
| MILLENNIUM MANAGEMENT LLC |
2263 |
- |
2023-12-31 |
510,189 |
$2,408,000 |
-1,105,486 |
|
| Squarepoint Ops LLC |
960 |
- |
2023-12-31 |
489,435 |
$2,310,000 |
-51,815 |
|
| MARATHON CAPITAL MANAGEMENT |
49 |
- |
2023-12-31 |
459,000 |
$2,166,000 |
-26,800 |
|
| D E SHAW & CO INC |
1564 |
- |
2023-12-31 |
456,012 |
$2,152,000 |
-778,126 |
|
| NEXT CENTURY GROWTH INVESTORS LLC |
99 |
- |
2023-12-31 |
441,338 |
$2,083,000 |
-373,712 |
|
| TWO SIGMA ADVISERS, LLC |
1329 |
- |
2023-12-31 |
390,200 |
$1,842,000 |
-31,400 |
|
| TUDOR INVESTMENT CORP ET AL |
744 |
- |
2023-12-31 |
385,493 |
$1,820,000 |
-5,635 |
|
| MARSHALL WACE LLP |
1031 |
- |
2023-12-31 |
373,622 |
$1,763,000 |
-72,355 |
|
| VOLORIDGE INVESTMENT MANAGEMENT LLC |
857 |
- |
2023-12-31 |
370,916 |
$1,751,000 |
-394,392 |
|
| BANK OF NEW YORK MELLON CORP |
2832 |
- |
2024-03-31 |
388,996 |
$1,731,000 |
-20,751 |
|
| Baird Financial Group Inc. |
1007 |
- |
2023-12-31 |
326,035 |
$1,539,000 |
-4 |
|
| STIFEL FINANCIAL CORP |
1859 |
- |
2023-12-31 |
321,071 |
$1,515,000 |
-19,077 |
|
| CASTLEARK MANAGEMENT LLC |
190 |
- |
2023-12-31 |
297,258 |
$1,403,000 |
-246,830 |
|
| Russell Investments Group Ltd. |
1856 |
- |
2023-12-31 |
240,955 |
$1,137,000 |
-226,386 |
|
| CALAMOS ADVISORS LLC |
475 |
- |
2023-12-31 |
128,659 |
$607,000 |
-117,093 |
|
| Jump Financial LLC |
955 |
- |
2023-12-31 |
119,321 |
$563,000 |
-46,879 |
|
| 1492 Capital Management LLC |
72 |
- |
2023-12-31 |
113,477 |
$536,000 |
-81,118 |
|
| J P MORGAN CHASE & CO |
3656 |
- |
2023-12-31 |
109,786 |
$518,000 |
-30,286 |
|
| Cubist Systematic Strategies LLC |
1367 |
- |
2023-12-31 |
104,255 |
$492,000 |
-239,949 |
|
| Caption Management LLC |
216 |
- |
2023-12-31 |
103,939 |
$491,000 |
-54,293 |
|
| APIS CAPITAL ADVISORS, LLC |
25 |
- |
2023-12-31 |
100,000 |
$472,000 |
-40,000 |
|
| Numerai GP LLC |
158 |
- |
2023-12-31 |
92,781 |
$438,000 |
-39,290 |
|
| CREDIT SUISSE/ |
2747 |
- |
2023-12-31 |
78,355 |
$370,000 |
-2,513 |
|
| JANE STREET GROUP LLC |
4415 |
- |
2023-12-31 |
62,648 |
$296,000 |
-30,354 |
|
| DEUTSCHE BANK AG |
2579 |
- |
2023-12-31 |
60,199 |
$284,000 |
-1,199 |
|
| FRANKLIN RESOURCES INC |
2192 |
- |
2023-12-31 |
53,446 |
$252,000 |
-43 |
|
| INVESCO LTD |
3426 |
- |
2023-12-31 |
44,597 |
$210,000 |
-19,114 |
|
| Harvest Investment Services LLC |
175 |
- |
2023-12-31 |
38,335 |
$181,000 |
-739 |
|
| GRAHAM CAPITAL MANAGEMENT LP |
816 |
- |
2023-12-31 |
35,295 |
$167,000 |
-40,571 |
|
| Atria Wealth Solutions Inc. |
1790 |
- |
2023-12-31 |
35,000 |
$165,000 |
-200 |
|
| SEI INVESTMENTS CO |
2444 |
- |
2023-12-31 |
23,991 |
$113,000 |
-6,710 |
|
| HRT FINANCIAL LLC |
1708 |
- |
2023-12-31 |
22,481 |
$106,000 |
-91,590 |
|
| THOMPSON DAVIS & CO. INC. |
90 |
- |
2023-12-31 |
16,000 |
$76,000 |
-7,800 |
|
| PRINCIPAL FINANCIAL GROUP INC |
2305 |
- |
2023-12-31 |
14,593 |
$69,000 |
-135,536 |
|
| INNOVIS ASSET MANAGEMENT LLC |
153 |
- |
2023-09-30 |
12,653 |
$61,000 |
-12,367 |
|
| Legacy Advisors LLC |
301 |
- |
2023-12-31 |
11,094 |
$52,000 |
-326 |
|
| State of Wyoming |
1349 |
- |
2023-12-31 |
9,442 |
$45,000 |
-4,461 |
|
| Advisor Group Holdings Inc. |
5114 |
- |
2023-12-31 |
6,988 |
$33,000 |
-4,150 |
|
| AMALGAMATED BANK |
2208 |
- |
2024-03-31 |
3,894 |
$17,000 |
-7,148 |
|
| CWM LLC |
4038 |
- |
2024-03-31 |
193 |
$1,000 |
-171 |
|
| NISA INVESTMENT ADVISORS L L C |
|
- |
2023-12-31 |
40 |
$0 |
-55 |
|
|
48 Records found
|
1
|
Page 1 of 1 |
|
Download: (Current
Quarter Only)
|
|
|
Download only Institutional Holders.
(Default)
Download only
Summary Infomation.
Download
both Summary and Institutional Data
|
|
|
|
Free Registration Required For Full Results
|
|
|