| |
Institutional
Holders
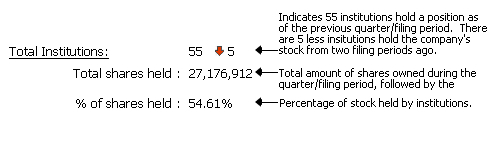
Total
Institutions:
 |
169  2 2 |
|
|
Total
shares held :
|
19,709,737 |
|
|
% of shares
held :
|
2.25% |
|
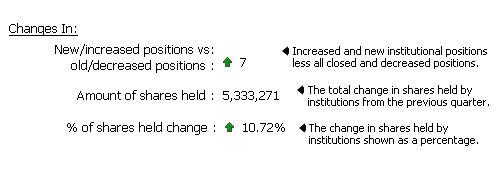
| Changes In:
|
|
|
|
New/increased
positions vs
old/decreased
positions :
|
-22 |
|
|
Amount
of shares held :
|
-6,627,077 |
|
|
% of shares
held change :
|
-0.76% |
|
| Quarter
Price vs. Current Price:
|
|
|
Quarter Price vs.
Current Price:
|
|
|
|
|
|
|
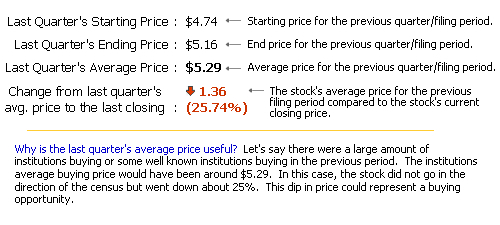
Last
Quarter's Starting
Price :
|
$25.74 |
|
|
Last
Quarter's Ending
Price :
|
$29.69 |
|
|
Last
Quarter's Average
Price :
|
$27.28 |
|
|
Change
from last quarter's
avg. price
to the last closing :
|
|
|
 3.11 (11.4%) 3.11 (11.4%) |
|
|
|

|

|

|
| All
Securities Held : |
Positions
|
Shares
|
%
Of
Total Shares
|
|
|
New
Positions : |
18
|
577,876
|
2.93%
|
|
 |
Increased
Positions : |
42
|
2,098,333
|
10.65%
|
|
|
|
Unchanged
Positions : |
47
|
1,245,510
|
6.32%
|
|
|
|
Decreased
Positions : |
62
|
-8,161,457
|
-41.41%
|
|
|
|
Closed
Positions : |
20
|
-1,141,829
|
-5.79%
|
|
|
|
Guru
Positions : |
1
|
77,526
|
0.39%
|
|
|

|
Free Registration Required For Full Results
|
Institution Name |
Portfolio
Position |
New/Closed
Position |
Filing Date |
Total Shares |
Total Value |
Change in Shares |
File |
  JANE STREET GROUP LLC JANE STREET GROUP LLC |
202 |
- |
2023-12-31 |
2,147,236 |
$63,751,000 |
777,049 |
|
| TD ASSET MANAGEMENT INC |
422 |
- |
2023-12-31 |
824,625 |
$24,483,000 |
572 |
|
| MORNINGSTAR INVESTMENT SERVICES, INC. |
121 |
- |
2023-12-31 |
732,063 |
$21,713,000 |
360,774 |
|
| CX Institutional |
35 |
- |
2024-03-31 |
476,347 |
$15,124,000 |
124,682 |
|
| ENVESTNET ASSET MANAGEMENT INC |
1373 |
- |
2023-12-31 |
371,477 |
$11,029,000 |
10,187 |
|
| MILLENNIUM MANAGEMENT LLC |
1518 |
- |
2023-12-31 |
276,475 |
$8,209,000 |
276,475 |
|
| Main Management ETF Advisors LLC |
29 |
- |
2023-12-31 |
226,085 |
$6,712,000 |
14,685 |
|
| BANK OF AMERICA CORP /DE/ |
2707 |
- |
2023-12-31 |
218,348 |
$6,483,000 |
17,135 |
|
| NEW VERNON CAPITAL HOLDINGS II LLC |
8 |
- |
2023-12-31 |
205,028 |
$6,087,000 |
16,823 |
|
| HIGHTOWER ADVISORS, LLC |
884 |
- |
2023-12-31 |
197,910 |
$5,871,000 |
825 |
|
| CAPITAL FUND MANAGEMENT S.A. |
317 |
- |
2023-12-31 |
190,973 |
$5,670,000 |
123,800 |
|
| PRUDENTIAL CORP PLC |
255 |
- |
2023-12-31 |
158,100 |
$4,694,000 |
150,900 |
|
| ROYAL BANK OF CANADA |
2191 |
- |
2023-12-31 |
110,831 |
$3,291,000 |
45,329 |
|
| INNEALTA CAPITAL LLC |
21 |
- |
2023-12-31 |
107,090 |
$3,180,000 |
17,061 |
|
| Idaho Trust Bank |
30 |
- |
2023-12-31 |
67,595 |
$2,006,000 |
10,515 |
|
| RENAISSANCE TECHNOLOGIES LLC |
1960 |
- |
2023-12-31 |
65,700 |
$1,951,000 |
65,700 |
|
| FLOW TRADERS U.S. LLC |
236 |
- |
2023-12-31 |
59,464 |
$1,765,000 |
8,593 |
|
| Boothe Investment Group Inc. |
26 |
- |
2023-12-31 |
54,098 |
$1,606,000 |
742 |
|
| Zurich Insurance Group Ltd/FI |
193 |
- |
2023-12-31 |
52,230 |
$1,526,000 |
26,530 |
|
| SG AMERICAS SECURITIES LLC |
714 |
- |
2023-12-31 |
44,173 |
$1,311,000 |
18,749 |
|
| TD Waterhouse Canada Inc. |
383 |
- |
2023-12-31 |
34,831 |
$1,270,000 |
186 |
|
| PROSPERA FINANCIAL SERVICES |
506 |
- |
2023-12-31 |
29,008 |
$861,000 |
442 |
|
| CAMBRIDGE INVESTMENT RESEARCH ADVISORS INC |
1875 |
- |
2024-03-31 |
25,286 |
$803,000 |
16,526 |
|
| GOLDMAN SACHS GROUP INC/ |
3637 |
- |
2023-12-31 |
26,022 |
$773,000 |
4,090 |
|
| MT LUCAS MANAGEMENT CORP |
98 |
- |
2023-12-31 |
24,925 |
$740,000 |
6,086 |
|
| TWO SIGMA SECURITIES LLC |
410 |
- |
2023-12-31 |
17,072 |
$507,000 |
3,250 |
|
| HRT FINANCIAL LLC |
1250 |
- |
2023-12-31 |
16,927 |
$502,000 |
16,927 |
|
| COMMONWEALTH EQUITY SERVICES LLC. |
2771 |
- |
2023-12-31 |
14,753 |
$438,000 |
2,102 |
|
| BCJ Capital Management LLC |
203 |
- |
2023-12-31 |
14,552 |
$432,000 |
3,718 |
|
| CIBC WORLD MARKETS INC. |
925 |
- |
2023-12-31 |
12,436 |
$369,000 |
53 |
|
| Coppell Advisory Solutions LLC |
237 |
- |
2023-12-31 |
8,216 |
$244,000 |
8,216 |
|
| Donald L. Hagan LLC |
93 |
- |
2024-03-31 |
7,457 |
$237,000 |
7,457 |
|
| Continuum Advisory LLC |
434 |
- |
2023-12-31 |
7,138 |
$212,000 |
7,138 |
|
| Gilbert & Cook Inc. |
213 |
- |
2023-12-31 |
6,746 |
$200,000 |
6,746 |
|
| TOWER RESEARCH CAPITAL LLC |
2149 |
- |
2023-12-31 |
6,349 |
$189,000 |
4,995 |
|
| COMERICA BANK |
2343 |
- |
2023-12-31 |
5,202 |
$154,000 |
68 |
|
| NISA INVESTMENT ADVISORS L L C |
|
- |
2023-12-31 |
3,900 |
$116,000 |
950 |
|
| Raleigh Capital Management Inc. |
387 |
- |
2023-12-31 |
901 |
$27,000 |
212 |
|
| CWM LLC |
2842 |
- |
2024-03-31 |
655 |
$21,000 |
500 |
|
| Coastal Investment Advisors Inc. |
644 |
- |
2024-03-31 |
583 |
$19,000 |
583 |
|
| HORIZON INVESTMENTS, LLC/SC |
633 |
- |
2023-12-31 |
415 |
$12,000 |
415 |
|
| ICA Group Wealth Management LLC |
1260 |
- |
2023-12-31 |
29 |
$1,000 |
29 |
|
|
42 Records found
|
1
|
Page 1 of 1 |
|
Download: (Current
Quarter Only)
|
|
|
Download only Institutional Holders.
(Default)
Download only
Summary Infomation.
Download
both Summary and Institutional Data
|
|
|
|
Free Registration Required For Full Results
|
|
|