| |
Institutional
Holders
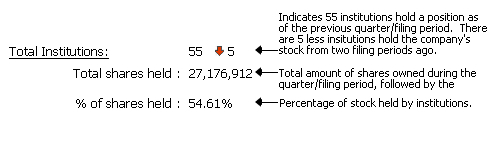
Total
Institutions:
 |
34  2 2 |
|
|
Total
shares held :
|
1,260,705 |
|
|
% of shares
held :
|
38.79% |
|
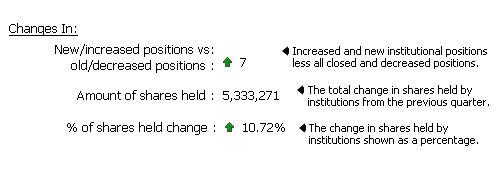
| Changes In:
|
|
|
|
New/increased
positions vs
old/decreased
positions :
|
-8 |
|
|
Amount
of shares held :
|
-55,510 |
|
|
% of shares
held change :
|
-1.71% |
|
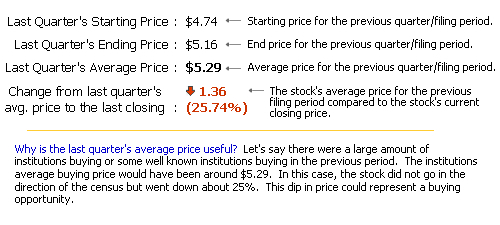
| Quarter
Price vs. Current Price:
|
|
|
Quarter Price vs.
Current Price:
|
|
|
|
|
|
|
Last
Quarter's Starting
Price :
|
N/A |
|
|
Last
Quarter's Ending
Price :
|
N/A |
|
|
Last
Quarter's Average
Price :
|
N/A |
|
|
Change
from last quarter's
avg. price
to the last closing :
|
|
|
|
(%) |
|
|
|
|

|
|
|
|

|
Free Registration Required For Full Results
|
Institution Name |
Portfolio
Position |
New/Closed
Position |
Filing Date |
Total Shares |
Total Value |
Change in Shares |
File |
  ENVESTNET ASSET MANAGEMENT INC ENVESTNET ASSET MANAGEMENT INC |
1812 |
- |
2023-12-31 |
194,937 |
$5,620,000 |
-4,075 |
|
| Golden State Equity Partners |
14 |
- |
2023-12-31 |
170,172 |
$4,864,000 |
-13,421 |
|
| CAMBRIDGE INVESTMENT RESEARCH ADVISORS INC |
779 |
- |
2024-03-31 |
161,163 |
$4,717,000 |
-1,591 |
|
| LPL FINANCIAL CORP |
1829 |
- |
2023-12-31 |
138,159 |
$3,983,000 |
-10,060 |
|
| Cetera Investment Advisers |
659 |
- |
2023-12-31 |
95,316 |
$2,748,000 |
-2,785 |
|
| Advisor Group Holdings Inc. |
1913 |
- |
2023-12-31 |
64,596 |
$1,863,000 |
320 |
|
| JANE STREET GROUP LLC |
2582 |
- |
2023-12-31 |
60,940 |
$1,757,000 |
28,075 |
|
| RAYMOND JAMES & ASSOCIATES |
2328 |
- |
2024-03-31 |
50,953 |
$1,491,000 |
2,049 |
|
| FINANCIAL NETWORK |
1146 |
- |
2023-12-31 |
49,239 |
$1,420,000 |
-1,693 |
|
| Orion Portfolio Solutions LLC |
862 |
- |
2023-12-31 |
41,689 |
$1,207,000 |
-1,285 |
|
| OLD MISSION CAPITAL LLC |
437 |
- |
2023-12-31 |
33,509 |
$966,000 |
0 |
|
| FLOW TRADERS U.S. LLC |
375 |
*New |
2023-12-31 |
28,999 |
$836,000 |
28,999 |
|
| H D Vest Advisory Services |
812 |
- |
2023-12-31 |
26,694 |
$770,000 |
15,082 |
|
| Envestnet Portfolio Solutions Inc. |
974 |
- |
2023-12-31 |
20,649 |
$595,000 |
1,357 |
|
| MULTIFINANCIAL SECURITIES CORP |
1087 |
- |
2023-12-31 |
18,573 |
$535,000 |
1,034 |
|
| CITADEL ADVISORS LLC |
3556 |
- |
2023-12-31 |
18,105 |
$522,000 |
-2,509 |
|
| SUSQUEHANNA INTERNATIONAL GROUP, LLP |
3724 |
*New |
2023-12-31 |
17,944 |
$517,000 |
17,944 |
|
| Gladstone Institutional Advisory LLC |
480 |
- |
2023-12-31 |
12,869 |
$371,000 |
-835 |
|
| HARBOUR INVESTMENTS INC. |
651 |
- |
2023-12-31 |
12,440 |
$359,000 |
-8,062 |
|
| PRINCIPAL SECURITIES INC. |
798 |
- |
2024-03-31 |
12,015 |
$352,000 |
1,239 |
|
| MONEYWISE INC. |
51 |
- |
2024-03-31 |
11,340 |
$332,000 |
-304 |
|
| BB&T CORP |
2286 |
- |
2023-12-31 |
9,841 |
$284,000 |
-259 |
|
| Atria Wealth Solutions Inc. |
1525 |
- |
2023-12-31 |
9,733 |
$281,000 |
1,604 |
|
| BANK OF NEW YORK MELLON CORP |
3791 |
*New |
2024-03-31 |
6,933 |
$203,000 |
6,933 |
|
| ROYAL BANK OF CANADA |
5736 |
- |
2023-12-31 |
448 |
$12,000 |
-613 |
|
| Global Retirement Partners LLC |
2035 |
- |
2024-03-31 |
400 |
$12,000 |
0 |
|
| COMERICA BANK |
3130 |
- |
2023-12-31 |
312 |
$9,000 |
0 |
|
| UBS Group AG |
6228 |
- |
2023-12-31 |
241 |
$7,000 |
-464 |
|
| Larson Financial Group LLC |
1218 |
- |
2024-03-31 |
138 |
$4,000 |
1 |
|
| MORGAN STANLEY |
6632 |
- |
2023-12-31 |
142 |
$4,000 |
0 |
|
| HORIZON INVESTMENTS, LLC/SC |
651 |
- |
2023-12-31 |
56 |
$2,000 |
-31 |
|
| Coppell Advisory Solutions LLC |
1324 |
- |
2023-12-31 |
67 |
$2,000 |
67 |
|
| PROEQUITIES INC. |
3194 |
- |
2024-03-31 |
0 |
$0 |
0 |
|
| Cape Investment Advisory Inc. |
1061 |
*Closed |
2023-12-31 |
0 |
$0 |
-392 |
|
| WELLS FARGO & CO/MN |
6424 |
- |
2023-12-31 |
1 |
$0 |
0 |
|
| Geneos Wealth Management Inc. |
2154 |
*Closed |
2024-03-31 |
0 |
$0 |
-419 |
|
| FMR LLC |
5400 |
*Closed |
2023-12-31 |
0 |
$0 |
-1 |
|
|
37 Records found
|
1
|
Page 1 of 1 |
|
Download: (Current
Quarter Only)
|
|
|
Download only Institutional Holders.
(Default)
Download only
Summary Infomation.
Download
both Summary and Institutional Data
|
|
|
|
Free Registration Required For Full Results
|
|
|