| |
Institutional
Holders
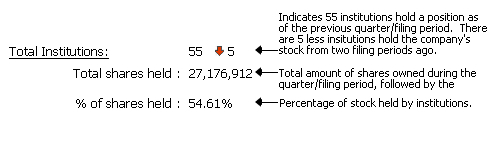
Total
Institutions:
 |
42  7 7 |
|
|
Total
shares held :
|
26,703,781 |
|
|
% of shares
held :
|
25.27% |
|
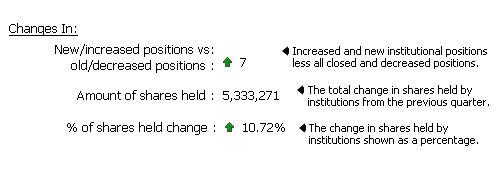
| Changes In:
|
|
|
|
New/increased
positions vs
old/decreased
positions :
|
-1 |
|
|
Amount
of shares held :
|
-853,041 |
|
|
% of shares
held change :
|
-0.81% |
|
| Quarter
Price vs. Current Price:
|
|
|
Quarter Price vs.
Current Price:
|
|
|
|
|
|
|
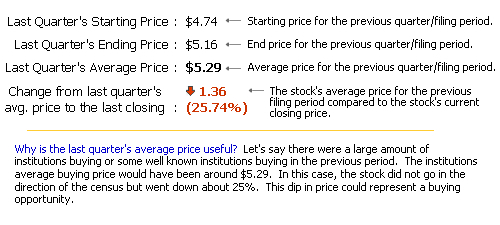
Last
Quarter's Starting
Price :
|
$0.48 |
|
|
Last
Quarter's Ending
Price :
|
$0.43 |
|
|
Last
Quarter's Average
Price :
|
$0.45 |
|
|
Change
from last quarter's
avg. price
to the last closing :
|
|
|
|
0.04 (8.89%) |
|
|
|

|

|
|
|
|

|
Free Registration Required For Full Results
|
Institution Name |
Portfolio
Position |
New/Closed
Position |
Filing Date |
Total Shares |
Total Value |
Change in Shares |
File |
  TSP CAPITAL MANAGEMENT GROUP LLC TSP CAPITAL MANAGEMENT GROUP LLC |
30 |
- |
2023-12-31 |
4,782,500 |
$2,056,000 |
-1,145,000 |
|
| Advisor Group Holdings Inc. |
5584 |
- |
2023-12-31 |
30,457 |
$13,000 |
-3,967 |
|
| MILLENNIUM MANAGEMENT LLC |
3851 |
- |
2023-12-31 |
20,589 |
$9,000 |
-15,563 |
|
| CREDIT AGRICOLE S A |
830 |
- |
2023-12-31 |
167 |
$0 |
-866 |
|
|
4 Records found
|
1
|
Page 1 of 1 |
|
Download: (Current
Quarter Only)
|
|
|
Download only Institutional Holders.
(Default)
Download only
Summary Infomation.
Download
both Summary and Institutional Data
|
|
|
|
Free Registration Required For Full Results
|
|
|