| |
Institutional
Holders
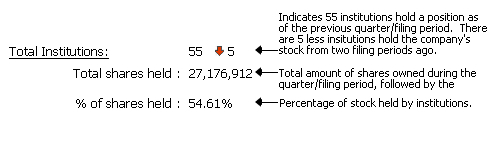
Total
Institutions:
 |
12  0 0 |
|
|
Total
shares held :
|
7,157,618 |
|
|
% of shares
held :
|
16.96% |
|
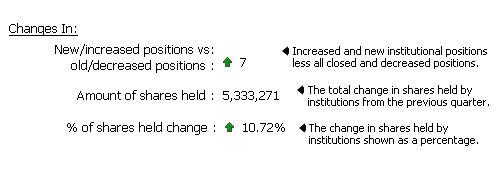
| Changes In:
|
|
|
|
New/increased
positions vs
old/decreased
positions :
|
 -2 -2 |
|
|
Amount
of shares held :
|
-151,330 |
|
|
% of shares
held change :
|
-0.36% |
|
| Quarter
Price vs. Current Price:
|
|
|
Quarter Price vs.
Current Price:
|
|
|
|
|
|
|
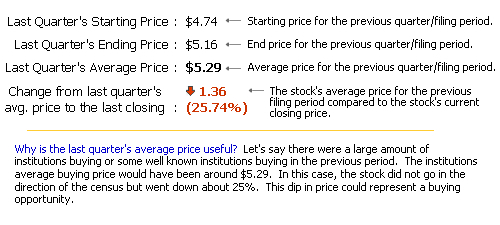
Last
Quarter's Starting
Price :
|
$1.70 |
|
|
Last
Quarter's Ending
Price :
|
$2.95 |
|
|
Last
Quarter's Average
Price :
|
$2.06 |
|
|
Change
from last quarter's
avg. price
to the last closing :
|
|
|
|
1.52 (73.79%) |
|
|
|

|

|


|
|
|

|
Free Registration Required For Full Results
|
Institution Name |
Portfolio
Position |
New/Closed
Position |
Filing Date |
Total Shares |
Total Value |
Change in Shares |
File |
  BAKER BROS ADVISORS LLC BAKER BROS ADVISORS LLC |
55 |
- |
2023-12-31 |
2,588,645 |
$7,637,000 |
-102,246 |
|
| VICTORY CAPITAL MANAGEMENT INC |
1286 |
- |
2024-03-31 |
855,524 |
$3,516,000 |
-28,551 |
|
| MILLENNIUM MANAGEMENT LLC |
3417 |
- |
2023-12-31 |
74,725 |
$220,000 |
-87,138 |
|
|
3 Records found
|
1
|
Page 1 of 1 |
|
Download: (Current
Quarter Only)
|
|
|
Download only Institutional Holders.
(Default)
Download only
Summary Infomation.
Download
both Summary and Institutional Data
|
|
|
|
Free Registration Required For Full Results
|
|
|