| |
Institutional
Holders
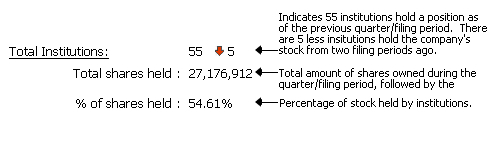
Total
Institutions:
 |
20  1 1 |
|
|
Total
shares held :
|
908,706 |
|
|
% of shares
held :
|
10.1% |
|
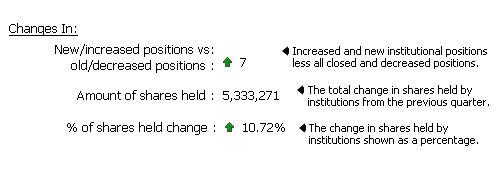
| Changes In:
|
|
|
|
New/increased
positions vs
old/decreased
positions :
|
9 |
|
|
Amount
of shares held :
|
25,347 |
|
|
% of shares
held change :
|
0.28% |
|
| Quarter
Price vs. Current Price:
|
|
|
Quarter Price vs.
Current Price:
|
|
|
|
|
|
|
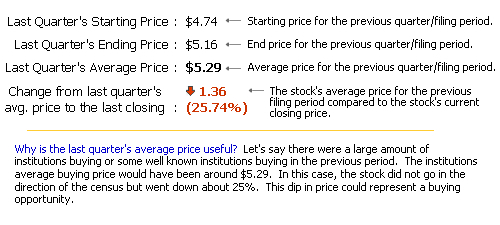
Last
Quarter's Starting
Price :
|
N/A |
|
|
Last
Quarter's Ending
Price :
|
N/A |
|
|
Last
Quarter's Average
Price :
|
N/A |
|
|
Change
from last quarter's
avg. price
to the last closing :
|
|
|
|
(%) |
|
|
|
|

|
|
|
|

|
Free Registration Required For Full Results
|
Institution Name |
Portfolio
Position |
New/Closed
Position |
Filing Date |
Total Shares |
Total Value |
Change in Shares |
File |
  FERGUSON WELLMAN CAPITAL MANAGEMENT INC FERGUSON WELLMAN CAPITAL MANAGEMENT INC |
30 |
- |
2024-03-31 |
667,487 |
$53,940,000 |
-1,450 |
|
| DUMONT & BLAKE INVESTMENT ADVISORS LLC |
8 |
- |
2024-03-31 |
96,820 |
$7,824,000 |
-1,352 |
|
| GOFEN & GLOSSBERG LLC /IL/ |
130 |
- |
2022-12-31 |
91,301 |
$5,365,000 |
1,181 |
|
| Coston McIsaac & Partners |
38 |
- |
2024-03-31 |
27,029 |
$2,184,000 |
-398 |
|
| Ethos Financial Group LLC |
46 |
*New |
2023-12-31 |
24,041 |
$1,757,000 |
24,041 |
|
| NEVILLE RODIE & SHAW INC |
101 |
- |
2024-03-31 |
19,838 |
$1,603,000 |
0 |
|
| Cribstone Capital Management LLC |
57 |
- |
2022-12-31 |
13,791 |
$810,000 |
1,300 |
|
| Financial Gravity Wealth Inc. |
241 |
- |
2023-12-31 |
9,272 |
$779,000 |
0 |
|
| NORTH STAR ASSET MANAGEMENT INC |
181 |
- |
2023-12-31 |
9,813 |
$717,000 |
525 |
|
| Grey Fox Wealth Advisors LLC |
46 |
- |
2024-03-31 |
8,340 |
$674,000 |
-24 |
|
| Garde Capital Inc. |
111 |
- |
2023-12-31 |
8,978 |
$656,000 |
4,935 |
|
| STALEY CAPITAL ADVISERS INC |
134 |
- |
2023-12-31 |
6,867 |
$502,000 |
0 |
|
| EDGAR LOMAX CO/VA |
53 |
- |
2023-12-31 |
6,634 |
$485,000 |
-454 |
|
| CARRET ASSET MANAGEMENT |
206 |
- |
2024-03-31 |
4,493 |
$363,000 |
-50 |
|
| WALLINGTON ASSET MANAGEMENT LLC |
57 |
- |
2024-03-31 |
4,490 |
$363,000 |
0 |
|
| GROVE CREEK ASSET MANAGEMENT |
105 |
- |
2023-12-31 |
4,855 |
$355,000 |
67 |
|
| Williams Jones Wealth Management LLC. |
394 |
- |
2023-12-31 |
4,636 |
$339,000 |
1,600 |
|
| TOWER BRIDGE ADVISORS |
196 |
- |
2023-12-31 |
3,622 |
$265,000 |
0 |
|
| ROWLAND & CO INVESTMENT COUNSEL/ADV |
145 |
- |
2024-03-31 |
2,040 |
$165,000 |
0 |
|
| Strategic Investment Solutions Inc. /IL |
130 |
- |
2023-12-31 |
2,138 |
$156,000 |
2,138 |
|
| Main Street Group LTD |
120 |
- |
2023-12-31 |
1,600 |
$117,000 |
0 |
|
| Westside Investment Management Inc. |
263 |
- |
2024-03-31 |
1,395 |
$113,000 |
0 |
|
| Cyrus J. Lawrence LLC |
99 |
- |
2023-09-30 |
825 |
$54,000 |
0 |
|
| Game Plan Financial Advisors LLC |
141 |
- |
2024-03-31 |
301 |
$24,000 |
0 |
|
| DB Fitzpatrick & Co Inc |
78 |
- |
2024-03-31 |
22 |
$2,000 |
0 |
|
| TUCKER ASSET MANAGEMENT LLC |
868 |
*New |
2023-12-31 |
15 |
$1,000 |
15 |
|
|
26 Records found
|
1
|
Page 1 of 1 |
|
Download: (Current
Quarter Only)
|
|
|
Download only Institutional Holders.
(Default)
Download only
Summary Infomation.
Download
both Summary and Institutional Data
|
|
|
|
Free Registration Required For Full Results
|
|
|