


|
|
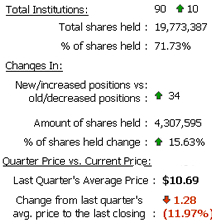
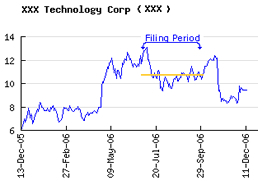
Institutional Chart |
|
|
Copyright © 2010 j3sg.com | Information provided
is for demonstration purposes only.
|
|
|
|||||||||||||
| Insider Chart | Institutional Chart | Summaries | Portfolio & Alerts | |||||||||||||||
|
|||||||||||||||
|
Copyright © 2010 j3sg.com | Information provided
is for demonstration purposes only.
|
|||||||||||||||