| |
| Weekly Summary - Buys |
 |
Explanation |
| |
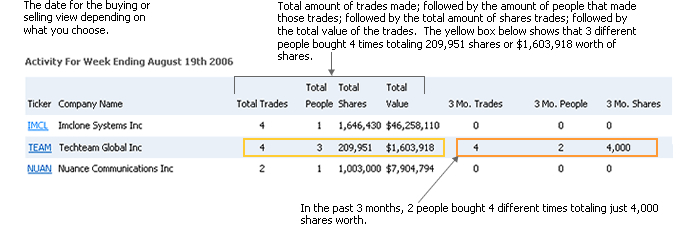
Below are today's Form 4 insider buying
transaction data filed with the SEC (Securities & Exchange
Commission, www.sec.gov). Transactions are grouped
by company showing the amount of insiders and combined transaction
data. Also represented within each group is the company's
transaction summary history for the last 3 month. Data
will show how many insiders, the total amount of transactions
that occurred, the amount of combined shares purchased and the
combined shares market value. Insider transaction
data is updated every 0-5 min Monday - Friday. The Form
3 (Initial Ownership Statement), Form 4 (Change in Ownership)
and form 5 (Insider who has at least one transaction which was
not reported during the year) are also sent in our daily summary
emails. |
|
|
| |
|
Activity For May 4th 2024
|
|
 |
Download |
|
Menu
 |
Ticker |
Company Name |
Total Trades |
| Avg. Rank |
 |
|
Total People |
Total Shares |
Total Value |
3 Mo. Trades |
3 Mo. People |
3 Mo. Shares |


|
LSXMA |
Liberty Media Corporation |
7 |
0.01 |
1 |
1,458,653 |
$36,124,805 |
43 |
1 |
32,945,612 |
|
|
MSCI |
Msci Inc |
2 |
2.74 |
2 |
20,500 |
$9,502,530 |
2 |
2 |
20,500 |
|
|
HTLD |
Heartland Express Inc |
7 |
1.48 |
3 |
467,788 |
$4,737,842 |
8 |
3 |
482,721 |
|
|
RXO |
Rxo, Inc. |
2 |
0.01 |
1 |
200,000 |
$3,923,000 |
12 |
1 |
4,167,144 |
|
|
HQL |
Tekla Life Sciences Investors |
5 |
1.5 |
1 |
281,254 |
$3,672,029 |
9 |
2 |
429,802 |
|
|
STCN |
Steel Connect Inc |
3 |
2.25 |
1 |
265,326 |
$3,183,244 |
7 |
1 |
1,008,881 |
|
|
HXL |
Hexcel Corp |
6 |
0.01 |
5 |
49,000 |
$3,179,183 |
5 |
4 |
34,000 |
|
|
CTRN |
Citi Trends Inc |
6 |
1.5 |
1 |
116,700 |
$2,520,224 |
31 |
2 |
651,725 |
|
|
CLF |
Cleveland-Cliffs Inc |
2 |
2.6 |
2 |
85,000 |
$1,430,541 |
3 |
3 |
87,000 |
|
|
HTZ |
Hertz Global Holdings Inc |
1 |
2.81 |
1 |
250,000 |
$1,114,100 |
1 |
1 |
250,000 |
|
|
SWKS |
Skyworks Solutions Inc |
1 |
2.81 |
1 |
11,142 |
$1,002,780 |
0 |
0 |
0 |
|
|
JBHT |
JB Hunt Transport Services Inc |
1 |
0.01 |
1 |
6,200 |
$998,550 |
2 |
2 |
11,200 |
|
|
EXFY |
Expensify, Inc. |
3 |
0.01 |
1 |
547,982 |
$859,858 |
9 |
1 |
1,199,553 |
|
|
MAV |
Pioneer Municipal High Income Advantage Trust |
4 |
1.5 |
1 |
106,402 |
$833,468 |
5 |
1 |
125,393 |
|
|
TBBK |
The Bancorp Inc |
2 |
2.42 |
2 |
21,000 |
$651,558 |
9 |
2 |
18,090 |
|
|
GSHD |
Goosehead Insurance Inc |
1 |
2.81 |
1 |
10,000 |
$580,650 |
5 |
4 |
17,582 |
|
|
CVS |
CVS/Caremark Corp |
2 |
2.39 |
2 |
10,181 |
$554,173 |
0 |
0 |
0 |
|
|
GL |
Globe Life Inc |
4 |
2.32 |
4 |
6,819 |
$530,865 |
4 |
4 |
6,819 |
|
|
CHDN |
Churchill Downs Inc |
1 |
2.39 |
1 |
3,800 |
$494,836 |
1 |
1 |
3,800 |
|
|
NQP |
Nuveen Pennsylvania Investment Quality Municipal Fund Inc |
2 |
1.5 |
1 |
39,704 |
$455,242 |
16 |
1 |
406,077 |
|
|
ENPH |
Enphase Energy, Inc. |
1 |
2.74 |
1 |
4,000 |
$416,972 |
1 |
1 |
4,000 |
|
|
GRTX |
Galera Therapeutics, Inc. |
1 |
2.45 |
1 |
1,814,657 |
$403,185 |
7 |
1 |
2,909,659 |
|
|
CINF |
Cincinnati Financial Corp |
2 |
0.01 |
2 |
3,000 |
$336,753 |
2 |
2 |
3,000 |
|
|
NBBK |
Nb Bancorp, Inc. |
2 |
2.78 |
2 |
21,900 |
$318,902 |
11 |
7 |
82,140 |
|
|
GLQ |
Clough Global Equity Fund |
1 |
2.44 |
1 |
50,000 |
$317,900 |
3 |
1 |
90,000 |
|
| |
Transaction
Code Key: |
Ownership
Code Key |
| |
B |
- Buy |
AB |
- Automatic
Buy |
D |
- Direct Ownership |
| |
S |
- Sell |
AS |
- Automatic
Sell |
I |
- Indirect
Ownership |
| |
OE |
- Options
Exercised |
A |
- Acquired |
| |
IO |
- Initital
Ownership |
D |
- Disposed |
| |
|
|
|
|
|
|
|