| |
| Today's Summary Breakdown
- Buys |
 |
Explanation |
|
|
| |
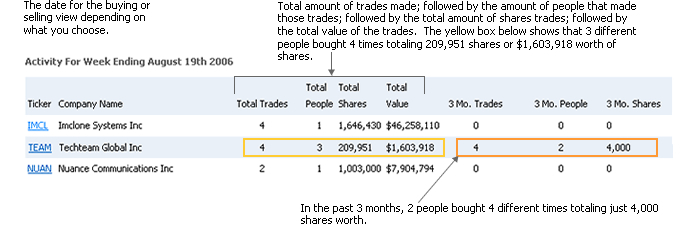
Below are today's Form 4 insider buying
transaction data filed with the SEC (Securities & Exchange
Commission, www.sec.gov). Transactions are grouped
by company showing the amount of insiders and combined transaction
data. Also represented within each group is the company's
transaction summary history for the last 3 month. Data
will show how many insiders, the total amount of transactions
that occurred, the amount of combined shares purchased and the
combined shares market value. Insider transaction
data is updated every 0-5 min Monday - Friday. The Form
3 (Initial Ownership Statement), Form 4 (Change in Ownership)
and form 5 (Insider who has at least one transaction which was
not reported during the year) are also sent in our daily summary
emails. |
|
|
Activity For May 3rd 2024
|
|
 |
Download |
|
Menu
 |
Ticker |
Company Name |
Total Trades |
| Avg. Rank |
 |
|
Total People |
Total Shares |
Total Value |
3 Mo. Trades |
3 Mo. People |
3 Mo. Shares |


|
TBPH |
Theravance Biopharma, Inc. |
1 |
1.5 |
1 |
1,499,124 |
$13,117,335 |
0 |
0 |
0 |
|
|
UVBIF |
Universal Biosensors Inc |
1 |
2.25 |
1 |
29,506,606 |
$4,425,991 |
1 |
1 |
1,000,000 |
|
|
HTLD |
Heartland Express Inc |
2 |
2.64 |
1 |
107,605 |
$1,155,307 |
8 |
3 |
482,721 |
|
|
LUMN |
Lumen Technologies, Inc |
1 |
2.81 |
1 |
750,000 |
$959,850 |
4 |
3 |
143,500 |
|
|
NQP |
Nuveen Pennsylvania Investment Quality Municipal Fund Inc |
1 |
1.5 |
1 |
65,807 |
$760,071 |
16 |
1 |
406,077 |
|
|
NXJ |
Nuveen New Jersey Dividend Advantage Municipal Fund |
1 |
1.5 |
1 |
50,596 |
$596,527 |
13 |
1 |
231,405 |
|
|
DAL |
Delta Air Lines Inc |
1 |
2.39 |
1 |
10,000 |
$494,955 |
0 |
0 |
0 |
|
|
VPV |
Invesco Van Kampen Penn Va |
1 |
1.5 |
1 |
30,935 |
$308,113 |
12 |
1 |
165,020 |
|
|
MHI |
Pioneer Municipal High Income Trust |
1 |
1.5 |
1 |
32,971 |
$282,232 |
3 |
1 |
116,307 |
|
|
MEGI |
Mainstay Cbre Global Infrastructure Megatrends Fund |
1 |
1.5 |
1 |
12,874 |
$158,736 |
5 |
2 |
119,874 |
|
|
FRTX |
Fresh Tracks Therapeutics Ord Shs |
3 |
0.01 |
1 |
164,897 |
$151,680 |
20 |
1 |
210,807 |
|
|
LEG |
Leggett & Platt Inc |
1 |
2.74 |
1 |
10,000 |
$133,900 |
0 |
0 |
0 |
|
|
TRS |
Trimas Corp |
3 |
2.39 |
1 |
4,000 |
$104,959 |
3 |
3 |
11,010 |
|
|
LOGI |
Logitech International S.A (ADR) |
1 |
0.01 |
1 |
1,225 |
$99,560 |
0 |
0 |
0 |
|
|
IZEA |
Izea Worldwide Inc |
3 |
1.47 |
1 |
29,230 |
$85,005 |
5 |
1 |
108,473 |
|
|
AIN |
Albany International Corp |
1 |
2.74 |
1 |
1,000 |
$84,440 |
0 |
0 |
0 |
|
|
ETST |
Earth Science Tech, Inc |
2 |
2.6 |
2 |
809,841 |
$79,109 |
16 |
2 |
1,141,331 |
|
|
SAMG |
Silvercrest Asset Management Group Inc. |
1 |
2.45 |
1 |
5,112 |
$76,936 |
2 |
2 |
8,247 |
|
|
IHT |
Innsuites Hospitality Trust |
1 |
4.01 |
1 |
200 |
$57,678 |
5 |
1 |
2,338 |
|
|
FRAF |
Franklin Financial Services Corp /pa/ |
2 |
2.39 |
2 |
1,500 |
$45,210 |
1 |
1 |
50 |
|
|
MOFG |
MidWestOne Financial Group Inc |
2 |
2.58 |
1 |
2,000 |
$42,168 |
2 |
1 |
5,447 |
|
|
RRBI |
Red River Bancshares Inc |
2 |
2.25 |
1 |
869 |
$41,029 |
2 |
1 |
1,500 |
|
|
FMBM |
F&M Bank Corp |
4 |
2.46 |
4 |
1,800 |
$28,800 |
10 |
6 |
4,213 |
|
|
BCBP |
BCB Bancorp Inc |
2 |
0.01 |
2 |
2,901 |
$27,933 |
3 |
2 |
2,550 |
|
|
FXNC |
First National Corp /va/ |
2 |
2.39 |
2 |
1,597 |
$24,035 |
2 |
2 |
5,257 |
|
|
EXFY |
Expensify, Inc. |
1 |
0.01 |
1 |
11,972 |
$19,155 |
9 |
1 |
1,199,553 |
|
|
AARI |
Patriot Minefinders Inc |
1 |
2.37 |
1 |
180,000 |
$17,100 |
6 |
3 |
8,106,320 |
|
|
PWOD |
Penns Woods Bancorp Inc |
1 |
2.39 |
1 |
500 |
$9,339 |
9 |
8 |
15,154 |
|
|
CMTV |
Community Bancorp /vt/ |
1 |
0.01 |
1 |
500 |
$7,970 |
9 |
5 |
5,603 |
|
|
HNVR |
Hanover Bancorp, Inc. /ny |
2 |
2.66 |
1 |
400 |
$6,648 |
10 |
5 |
4,150 |
|
|
EDBL |
Edible Garden Ag Inc |
1 |
1.5 |
1 |
1,005 |
$6,105 |
0 |
0 |
0 |
|
|
CCFN |
Ccfnb Bancorp Inc |
1 |
2.74 |
1 |
191 |
$5,921 |
2 |
2 |
600 |
|
|
TGEN |
Tecogen Inc |
1 |
2.31 |
1 |
5,000 |
$3,750 |
12 |
2 |
37,000 |
|
|
ISBA |
Isabella Bank Corporation |
1 |
2.66 |
1 |
58 |
$1,000 |
18 |
8 |
3,164 |
|
|
ISBA |
Isabella Bank Corporation |
1 |
2.66 |
1 |
29 |
$500 |
18 |
8 |
3,164 |
|
|
ISBA |
Isabella Bank Corporation |
1 |
2.66 |
1 |
29 |
$500 |
18 |
8 |
3,164 |
|
|
ISBA |
Isabella Bank Corporation |
1 |
2.73 |
1 |
23 |
$400 |
18 |
8 |
3,164 |
|
|
RGCO |
RGC Resources Inc |
2 |
2.66 |
2 |
15 |
$300 |
7 |
4 |
2,320 |
|
|
RCG |
RENN Global Entrepreneurs Fund, Inc |
2 |
2.66 |
1 |
59 |
$99 |
123 |
2 |
4,490 |
|
| |
Transaction
Code Key: |
Ownership
Code Key |
| |
B |
- Buy |
AB |
- Automatic
Buy |
D |
- Direct Ownership |
| |
S |
- Sell |
AS |
- Automatic
Sell |
I |
- Indirect
Ownership |
| |
OE |
- Options
Exercised |
A |
- Acquired |
| |
IO |
- Initital
Ownership |
D |
- Disposed |
| |
|
|
|
|
|
|
|