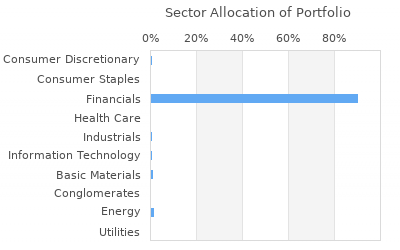
| |
|
|
| Name: |
THOMAS STORY & SON LLC |
| City: |
OAK BROOK |
| State: |
IL |
| Zip: |
60523 |
| |
|
|
| Achive
data |
| View
Filing Period: |
|
|
|
|
|

|
 |
Download |
|
|
| |
| |
|
Free Registration Required For Full Results
|
|
|
| Holdings
Found :
22 |
|
View All Holdings |
Currently
Viewing:
Decreased Positions |
|
|
Page 1 of 1 |
Menu
 |
Ticker |
Company Name |
Position
Rank |
New/Closed
Postion |
Last
Close |
Value |
Shares Held |
% of
Portfolio |
Value
Change |
Change In
Shares Held |
% of Company |
Industry |


|
V |
Visa Inc |
1 |
- |
$267.61 |
$14,651,000 |
56,276 |
6.88% |
1,658,000 |
-215 |
0.003 |
Business Services |


|
TSCO |
Tractor Supply Co |
2 |
- |
$266.70 |
$12,783,000 |
59,448 |
6% |
710,000 |
-10 |
0.051 |
Specialty Retail, Other |


|
COST |
Costco Wholesale Corp |
3 |
- |
$732.44 |
$12,680,000 |
19,210 |
5.96% |
1,824,000 |
-5 |
0.004 |
Discount, Variety Stores |


|
ORLY |
O Reilly Automotive Inc |
4 |
- |
$1,006.23 |
$11,183,000 |
11,771 |
5.25% |
-817,000 |
-1,432 |
0.016 |
Auto Parts Stores |


|
ACN |
Accenture Plc |
5 |
- |
$300.34 |
$11,006,000 |
31,365 |
5.17% |
1,318,000 |
-180 |
0.005 |
Management Services |


|
AAPL |
Apple Inc |
6 |
- |
$173.03 |
$10,371,000 |
53,866 |
4.87% |
338,000 |
-4,736 |
0 |
Personal Computers |


|
WSM |
Williams Sonoma Inc |
7 |
- |
$292.24 |
$10,087,000 |
49,992 |
4.74% |
2,316,000 |
-15 |
0.064 |
Home Furnishing Stores |


|
JNJ |
Johnson & Johnson |
8 |
- |
$149.92 |
$9,574,000 |
61,082 |
4.5% |
59,000 |
-10 |
0.002 |
Drug Manufacturers - ... |


|
PG |
Procter & Gamble Co |
10 |
- |
$163.84 |
$9,461,000 |
64,564 |
4.44% |
37,000 |
-45 |
0.003 |
Cleaning Products |


|
AMD |
Advanced Micro Devices Inc |
11 |
- |
$146.16 |
$8,431,000 |
57,195 |
3.96% |
2,492,000 |
-565 |
0.005 |
Semiconductor- Broad... |


|
INTC |
Intel Corp |
12 |
- |
$30.51 |
$6,871,000 |
136,731 |
3.23% |
474,000 |
-43,226 |
0.003 |
Semiconductor- Broad... |


|
ABT |
Abbott Laboratories |
14 |
- |
$105.92 |
$5,814,000 |
52,825 |
2.73% |
691,000 |
-70 |
0.003 |
Drug Manufacturers - ... |


|
ITW |
Illinois Tool Works Inc |
16 |
- |
$242.04 |
$5,681,000 |
21,687 |
2.67% |
640,000 |
-200 |
0.007 |
Diversified Machinery |


|
FAST |
Fastenal Co |
17 |
- |
$68.09 |
$5,385,000 |
83,137 |
2.53% |
777,000 |
-1,200 |
0.014 |
Home Improvement Stores |


|
CGNX |
Cognex Corp |
19 |
- |
$43.36 |
$5,178,000 |
124,062 |
2.43% |
-88,000 |
-25 |
0.071 |
Scientific & Technica... |


|
NKE |
Nike Inc B |
22 |
- |
$92.41 |
$3,434,000 |
31,630 |
1.61% |
400,000 |
-100 |
0.003 |
Textile - Apparel Foo... |


|
BX |
Blackstone Group LP |
23 |
- |
$120.62 |
$3,380,000 |
25,816 |
1.59% |
587,000 |
-250 |
0.004 |
Asset Management |


|
PAYX |
Paychex Inc |
30 |
- |
$118.45 |
$1,554,000 |
13,045 |
0.73% |
9,000 |
-350 |
0.004 |
Staffing & Outsourcin... |


|
KVUE |
Kenvue Inc. |
32 |
- |
$19.12 |
$1,404,000 |
65,219 |
0.66% |
65,000 |
-1,457 |
0.003 |
N/A |


|
CVX |
Chevron Corp |
36 |
- |
$160.73 |
$1,131,000 |
7,580 |
0.53% |
-4,568,000 |
-26,215 |
0 |
Integrated Oil & Gas |


|
CTRA |
Coterra Energy Inc |
41 |
- |
$27.16 |
$573,000 |
22,437 |
0.27% |
-37,000 |
-100 |
0.003 |
Independent Oil & Gas |


|
MSFT |
Microsoft Corp |
42 |
- |
$397.84 |
$562,000 |
1,495 |
0.26% |
58,000 |
-100 |
0 |
Application Software |
|


