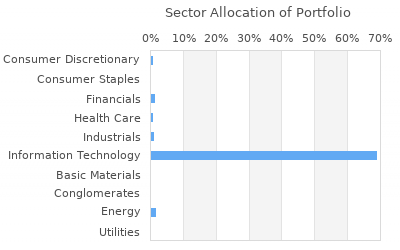
| |
|
|
| Name: |
HARVEST CAPITAL MANAGEMENT INC |
| City: |
CONCORD |
| State: |
NH |
| Zip: |
03301 |
| |
|
|
| Achive
data |
| View
Filing Period: |
|
|
|
|
|

|
 |
Download |
|
|
| |
| |
|
Free Registration Required For Full Results
|
|
|
| Holdings
Found :
28 |
|
View All Holdings |
Currently
Viewing:
Decreased Positions |
|
|
Page 1 of 1 |
Menu
 |
Ticker |
Company Name |
Position
Rank |
New/Closed
Postion |
Last
Close |
Value |
Shares Held |
% of
Portfolio |
Value
Change |
Change In
Shares Held |
% of Company |
Industry |


|
PDBC |
Invesco Actively Managd ETF |
6 |
- |
$13.95 |
$13,564,000 |
828,624 |
3.91% |
-4,479,000 |
-257,635 |
0.092 |
N/A |


|
EWMC |
Invesco S&P Midcap 400 Equa... |
7 |
- |
$115.12 |
$13,291,000 |
205,894 |
3.83% |
-566,000 |
-11,534 |
13.284 |
N/A |


|
DHS |
WisdomTree Trust High-Yield... |
13 |
- |
$82.50 |
$5,060,000 |
69,545 |
1.46% |
-183,000 |
-2,800 |
0.629 |
Closed - End Fund - E... |


|
JNJ |
Johnson & Johnson |
16 |
- |
$149.27 |
$3,715,000 |
26,675 |
1.07% |
-17,000 |
-20 |
0.001 |
Drug Manufacturers - ... |


|
MINT |
Pimco ETF Trust |
18 |
- |
$100.24 |
$3,393,000 |
33,355 |
0.98% |
-289,000 |
-2,895 |
0.036 |
Closed - End Fund - Debt |


|
DJP |
iPath Bloomberg Commodity I... |
19 |
- |
$32.00 |
$3,285,000 |
147,720 |
0.95% |
-85,000 |
-1,000 |
0.296 |
Foreign Money Center ... |


|
XOM |
Exxon Mobil Corp |
20 |
- |
$116.00 |
$3,171,000 |
41,384 |
0.91% |
-944,000 |
-9,542 |
0.001 |
Integrated Oil & Gas |


|
GSBD |
Goldman Sachs Bdc, Inc. |
22 |
- |
$15.58 |
$2,947,000 |
149,856 |
0.85% |
-174,000 |
-2,097 |
0.374 |
N/A |


|
BDX |
Becton Dickinson & Co |
23 |
- |
$234.68 |
$2,419,000 |
9,600 |
0.7% |
-228,000 |
-1,000 |
0.004 |
Medical Instruments &... |


|
VXUS |
Vanguard Total Internationa... |
24 |
- |
$60.39 |
$2,312,000 |
43,846 |
0.67% |
-55,000 |
-1,754 |
0.021 |
Closed - End Fund - E... |


|
MCI |
Barings Corporate Investors |
25 |
- |
$18.70 |
$2,130,000 |
136,120 |
0.61% |
-119,000 |
-9,333 |
1.461 |
Closed - End Fund - Debt |


|
ORCL |
Oracle Corp |
26 |
- |
$115.80 |
$1,573,000 |
27,626 |
0.45% |
-88,000 |
-3,298 |
0.001 |
Application Software |


|
PEP |
Pepsico Inc |
27 |
- |
$176.15 |
$1,571,000 |
11,985 |
0.45% |
90,000 |
-103 |
0.001 |
Beverage Soft Drinks... |


|
PFE |
Pfizer Inc |
30 |
- |
$27.81 |
$1,242,000 |
28,681 |
0.36% |
-78,000 |
-2,400 |
0 |
Drug Manufacturers - ... |


|
AAPL |
Apple Inc |
33 |
- |
$183.38 |
$1,001,000 |
5,059 |
0.29% |
23,000 |
-89 |
0 |
Personal Computers |


|
DIS |
Walt Disney Co |
38 |
- |
$113.66 |
$774,000 |
5,548 |
0.22% |
133,000 |
-228 |
0 |
Entertainment - Diver... |


|
IFEU |
Ishares Ftse Epra/Nareit E |
46 |
- |
$35.01 |
$598,000 |
16,537 |
0.17% |
-116,000 |
-2,300 |
1.575 |
Closed - End Fund - Debt |


|
T |
AT&T Corp |
47 |
- |
$16.85 |
$583,000 |
17,402 |
0.17% |
33,000 |
-144 |
0 |
Long Distance Carriers |


|
HON |
Honeywell International Inc |
51 |
- |
$195.81 |
$554,000 |
3,178 |
0.16% |
46,000 |
-21 |
0 |
Conglomerates |


|
IJR |
iShares Core S&P Small-Cap |
53 |
- |
$107.13 |
$519,000 |
6,641 |
0.15% |
3,000 |
-50 |
0.001 |
Closed - End Fund - E... |


|
MSFT |
Microsoft Corp |
57 |
- |
$406.66 |
$429,000 |
3,206 |
0.12% |
45,000 |
-50 |
0 |
Application Software |


|
CL |
Colgate Palmolive Co |
62 |
- |
$92.88 |
$395,000 |
5,525 |
0.11% |
11,000 |
-80 |
0.001 |
Personal Products |


|
ACN |
Accenture Plc |
67 |
- |
$303.71 |
$380,000 |
2,060 |
0.11% |
9,000 |
-50 |
0 |
Management Services |


|
GIS |
General Mills Inc |
70 |
- |
$69.91 |
$355,000 |
6,775 |
0.1% |
-7,000 |
-225 |
0.001 |
Food - Major Diversified |


|
CVX |
Chevron Corp |
76 |
- |
$160.25 |
$312,000 |
2,512 |
0.09% |
-1,000 |
-26 |
0 |
Integrated Oil & Gas |


|
SYK |
Stryker Corp |
81 |
- |
$328.45 |
$278,000 |
1,355 |
0.08% |
0 |
-50 |
0 |
Medical Instruments &... |


|
ABBV |
Abbvie Inc. |
88 |
- |
$163.79 |
$239,000 |
3,296 |
0.07% |
-212,000 |
-2,300 |
0 |
Drug Manufacturers - ... |


|
GE |
General Electric Co |
102 |
- |
$164.11 |
$19,000 |
1,812 |
0.04% |
-18,000 |
-313 |
0 |
Conglomerates |
|


