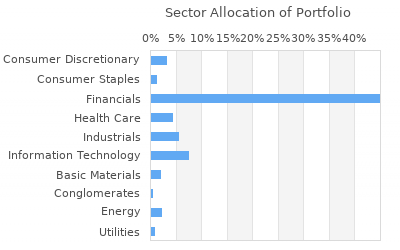
| |
|
|
| Name: |
GLENVIEW STATE BANK TRUST DEPT. |
| City: |
GLENVIEW |
| State: |
IL |
| Zip: |
60025 |
| |
|
|
| Achive
data |
| View
Filing Period: |
|
|
|
|
|

|
 |
Download |
|
|
| |
| |
|
Free Registration Required For Full Results
|
|
|
| Holdings
Found :
21 |
|
View All Holdings |
Currently
Viewing:
Increased Positions |
|
|
Page 1 of 1 |
Menu
 |
Ticker |
Company Name |
Position
Rank |
New/Closed
Postion |
Last
Close |
Value |
Shares Held |
% of
Portfolio |
Value
Change |
Change In
Shares Held |
% of Company |
Industry |


|
MCD |
McDonalds Corp |
11 |
- |
$269.30 |
$8,583,000 |
37,154 |
2.62% |
276,000 |
90 |
0.005 |
Restaurants |


|
VZ |
Verizon Communications Inc |
22 |
- |
$39.33 |
$4,280,000 |
76,388 |
1.31% |
-107,000 |
950 |
0.002 |
Telecom Services - Do... |


|
MRK |
Merck & Co Inc |
24 |
- |
$131.20 |
$4,010,000 |
51,559 |
1.23% |
81,000 |
600 |
0.002 |
Drug Manufacturers - ... |


|
HON |
Honeywell International Inc |
25 |
- |
$195.00 |
$3,834,000 |
17,478 |
1.17% |
54,000 |
65 |
0.002 |
Conglomerates |


|
PFF |
iShares S&P U.S. Preferred ... |
28 |
- |
$31.67 |
$3,298,000 |
83,839 |
1.01% |
82,000 |
100 |
0.017 |
Closed - End Fund - E... |


|
LMT |
Lockheed Martin Corp |
29 |
- |
$462.78 |
$3,126,000 |
8,262 |
0.96% |
84,000 |
30 |
0.003 |
Aerospace/Defense - M... |


|
MA |
MasterCard Inc A |
32 |
- |
$449.37 |
$2,525,000 |
6,916 |
0.77% |
143,000 |
225 |
0.001 |
Business Services |


|
CMI |
Cummins Inc |
34 |
- |
$283.59 |
$2,357,000 |
9,668 |
0.72% |
-86,000 |
240 |
0.007 |
Diversified Machinery |


|
MU |
Micron Technology Inc |
37 |
- |
$120.13 |
$2,209,000 |
26,000 |
0.67% |
21,000 |
1,200 |
0.002 |
Semiconductor - Memor... |


|
DE |
Deere & Co |
38 |
- |
$401.84 |
$2,094,000 |
5,937 |
0.64% |
-96,000 |
85 |
0.002 |
Farm & Construction M... |


|
AMZN |
Amazon.com Inc |
39 |
- |
$188.70 |
$1,975,000 |
574 |
0.6% |
348,000 |
48 |
0 |
Internet Software & S... |


|
IBM |
International Business Mach... |
41 |
- |
$168.61 |
$1,676,000 |
11,438 |
0.51% |
362,000 |
1,580 |
0.001 |
Diversified Computer ... |


|
BRK.B |
Berkshire Hathaway B |
51 |
- |
$404.92 |
$1,137,000 |
4,090 |
0.35% |
119,000 |
105 |
0 |
Property & Casualty I... |


|
HD |
Home Depot Inc |
53 |
- |
$342.29 |
$1,088,000 |
3,412 |
0.33% |
69,000 |
75 |
0 |
Home Improvement Stores |


|
AMGN |
Amgen Inc |
56 |
- |
$299.48 |
$1,027,000 |
4,212 |
0.31% |
28,000 |
200 |
0.001 |
Biotechnology |


|
FCX |
Freeport McMoRan Copper & G... |
66 |
- |
$50.99 |
$822,000 |
22,150 |
0.25% |
158,000 |
2,000 |
0.002 |
Copper |


|
ORCL |
Oracle Corp |
68 |
- |
$118.34 |
$787,000 |
10,118 |
0.24% |
88,000 |
150 |
0 |
Application Software |


|
MO |
Altria Group Inc |
71 |
- |
$43.49 |
$726,000 |
15,209 |
0.22% |
-10,000 |
825 |
0.001 |
Cigarettes & Other To... |


|
CSX |
CSX Corp |
93 |
- |
$33.68 |
$319,000 |
9,957 |
0.1% |
-1,000 |
6,638 |
0.001 |
Railroads |


|
QCOM |
QUALCOMM Inc |
96 |
- |
$181.85 |
$314,000 |
2,200 |
0.1% |
101,000 |
600 |
0 |
Communication Equipment |


|
RTX |
RTX Corp |
101 |
- |
$101.02 |
$295,000 |
3,458 |
0.09% |
37,000 |
116 |
0 |
Conglomerates |
|


