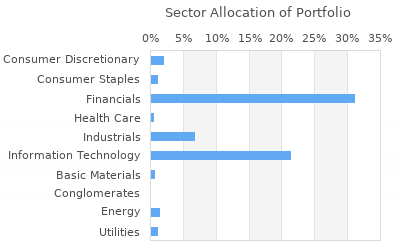
| |
|
|
| Name: |
Leisure Capital Management |
| City: |
COSTA MESA |
| State: |
CA |
| Zip: |
92626 |
| |
|
|
| Achive
data |
| View
Filing Period: |
|
|
|
|
|

|
 |
Download |
|
|
| |
| |
|
Free Registration Required For Full Results
|
|
|
| Holdings
Found :
28 |
|
View All Holdings |
Currently
Viewing:
Unchanged Positions |
|
|
Page 1 of 1 |
Menu
 |
Ticker |
Company Name |
Position
Rank |
New/Closed
Postion |
Last
Close |
Value |
Shares Held |
% of
Portfolio |
Value
Change |
Change In
Shares Held |
% of Company |
Industry |


|
SBRA |
Sabra Health Care Reit, Inc. |
4 |
- |
$14.22 |
$6,754,000 |
473,315 |
3.65% |
156,000 |
0 |
0.216 |
N/A |


|
HON |
Honeywell International Inc |
10 |
- |
$193.64 |
$3,313,000 |
15,799 |
1.79% |
394,000 |
0 |
0.002 |
Conglomerates |


|
HD |
Home Depot Inc |
12 |
- |
$335.53 |
$3,132,000 |
9,038 |
1.69% |
401,000 |
0 |
0.001 |
Home Improvement Stores |


|
AMP |
Ameriprise Financial Inc |
23 |
- |
$416.48 |
$2,034,000 |
5,355 |
1.1% |
269,000 |
0 |
0.005 |
Asset Management |


|
MPC |
Marathon Petroleum Corp |
47 |
- |
$182.95 |
$1,207,000 |
8,134 |
0.65% |
-24,000 |
0 |
0.001 |
Oil & Gas Refining, P... |


|
NKE |
Nike Inc B |
49 |
- |
$92.41 |
$1,162,000 |
10,704 |
0.63% |
138,000 |
0 |
0.001 |
Textile - Apparel Foo... |


|
GS |
Goldman Sachs Group Inc |
64 |
- |
$432.57 |
$943,000 |
2,445 |
0.51% |
152,000 |
0 |
0.001 |
Investment Brokerage ... |


|
MCK |
McKesson Corp |
77 |
- |
$531.10 |
$773,000 |
1,670 |
0.42% |
47,000 |
0 |
0.001 |
Drugs Wholesale |


|
GD |
General Dynamics Corp |
76 |
- |
$287.36 |
$773,000 |
2,976 |
0.42% |
115,000 |
0 |
0.002 |
Aerospace/Defense - M... |


|
AMZN |
Amazon.com Inc |
80 |
- |
$184.72 |
$743,000 |
4,893 |
0.4% |
121,000 |
0 |
0 |
Internet Software & S... |


|
EW |
Edwards Lifesciences Corp |
82 |
- |
$28.90 |
$723,000 |
9,482 |
0.39% |
66,000 |
0 |
0.002 |
Medical Appliances & ... |


|
MDY |
Standrd Poor Mdcp 400 SPDR |
83 |
- |
$530.06 |
$705,000 |
1,390 |
0.38% |
70,000 |
0 |
0.003 |
Closed - End Fund - E... |


|
FAF |
First American Financial Co... |
85 |
- |
$54.09 |
$670,000 |
10,401 |
0.36% |
82,000 |
0 |
0.009 |
Surety & Title Insurance |


|
BRK.B |
Berkshire Hathaway B |
86 |
- |
$400.60 |
$665,000 |
1,865 |
0.36% |
12,000 |
0 |
0 |
Property & Casualty I... |


|
LLY |
Eli Lilly & Co |
93 |
- |
$755.91 |
$534,000 |
915 |
0.29% |
42,000 |
0 |
0 |
Drug Manufacturers - ... |


|
PANW |
Palo Alto Networks Inc |
97 |
- |
$295.32 |
$501,000 |
1,698 |
0.27% |
103,000 |
0 |
0.001 |
Networking & Communic... |


|
CL |
Colgate Palmolive Co |
99 |
- |
$92.91 |
$489,000 |
6,136 |
0.26% |
53,000 |
0 |
0.001 |
Personal Products |


|
IJR |
iShares Core S&P Small-Cap |
101 |
- |
$106.33 |
$452,000 |
4,180 |
0.24% |
58,000 |
0 |
0.001 |
Closed - End Fund - E... |


|
TMO |
Thermo Fisher Scientific |
102 |
- |
$571.25 |
$430,000 |
810 |
0.23% |
20,000 |
0 |
0 |
Medical Laboratories ... |


|
UPS |
United Parcel Service Inc |
103 |
- |
$147.22 |
$416,000 |
2,645 |
0.22% |
4,000 |
0 |
0 |
AirDelivery & Freight... |


|
PH |
Parker Hannifin Corp |
106 |
- |
$530.68 |
$375,000 |
813 |
0.2% |
58,000 |
0 |
0.001 |
Industrial Equipment ... |


|
AMT |
American Tower Corp |
107 |
- |
$179.64 |
$365,000 |
1,693 |
0.2% |
87,000 |
0 |
0 |
Integrated Telecommun... |


|
PSX |
Phillips 66 |
111 |
- |
$143.87 |
$293,000 |
2,198 |
0.16% |
29,000 |
0 |
0.001 |
Oil & Gas Refining, P... |


|
ETE |
Energy Transfer Equity LP |
118 |
- |
$15.78 |
$235,000 |
17,000 |
0.13% |
-4,000 |
0 |
0.001 |
Oil & Gas Pipelines &... |


|
BGY |
Blackrock International Gro... |
121 |
- |
$5.31 |
$208,000 |
39,424 |
0.11% |
11,000 |
0 |
0.036 |
Closed - End Fund - E... |


|
BCX |
Blackrock Resources & Commo... |
125 |
- |
$9.18 |
$178,000 |
20,000 |
0.1% |
-6,000 |
0 |
0.02 |
Closed - End Fund - E... |


|
NRK |
Nuveen Insured New York Tax... |
126 |
- |
$10.77 |
$106,000 |
10,083 |
0.06% |
11,000 |
0 |
0.012 |
Closed - End Fund - Debt |


|
AGEN |
Antigenics Inc |
127 |
- |
$0.44 |
$9,000 |
10,577 |
0% |
-3,000 |
0 |
0.005 |
Biotechnology |
|


