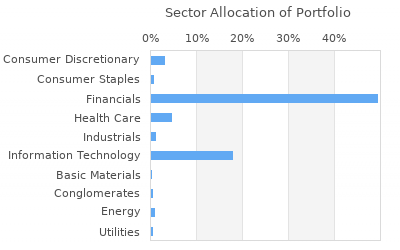
| |
|
|
| Name: |
LGT CAPITAL PARTNERS LTD. |
| City: |
PFAEFFIKON |
| State: |
V8 |
| Zip: |
8808 |
| |
|
|
| Achive
data |
| View
Filing Period: |
|
|
|
|
|

|
 |
Download |
|
|
| |
| |
|
Free Registration Required For Full Results
|
|
|
| Holdings
Found :
28 |
|
View All Holdings |
Currently
Viewing:
Increased Positions |
|
|
Page 1 of 1 |
Menu
 |
Ticker |
Company Name |
Position
Rank |
New/Closed
Postion |
Last
Close |
Value |
Shares Held |
% of
Portfolio |
Value
Change |
Change In
Shares Held |
% of Company |
Industry |


|
GOOGL |
Alphabet Inc |
2 |
- |
$169.38 |
$226,221,000 |
1,619,450 |
6.75% |
27,623,000 |
101,810 |
0.027 |
Search Engines & Info... |


|
INTU |
Intuit Inc |
3 |
- |
$632.43 |
$202,490,000 |
323,968 |
6.04% |
37,824,000 |
1,687 |
0.124 |
Application Software |


|
A |
Agilent Technologies Inc |
4 |
- |
$142.80 |
$187,167,000 |
1,346,234 |
5.59% |
58,943,000 |
199,532 |
0.436 |
Scientific & Technica... |


|
TSM |
Taiwan Semiconductor Mfg. C... |
5 |
- |
$143.60 |
$171,487,000 |
1,648,910 |
5.12% |
36,376,000 |
94,120 |
0.032 |
Semiconductor - Integ... |


|
EL |
Estee Lauder Companies Inc |
6 |
- |
$147.36 |
$159,255,000 |
1,088,926 |
4.75% |
22,211,000 |
140,855 |
0.481 |
Personal Products |


|
SYK |
Stryker Corp |
7 |
- |
$329.28 |
$130,264,000 |
434,997 |
3.89% |
34,686,000 |
85,240 |
0.116 |
Medical Instruments &... |


|
ROST |
Ross Stores Inc |
9 |
- |
$132.76 |
$125,869,000 |
909,527 |
3.76% |
73,280,000 |
443,932 |
0.255 |
Apparel Stores |


|
NDAQ |
Nasdaq OMX Group Inc |
13 |
- |
$59.91 |
$73,547,000 |
1,264,990 |
2.19% |
47,562,000 |
730,200 |
0.257 |
Business Services |


|
AZO |
Autozone Inc |
14 |
- |
$2,962.52 |
$70,458,000 |
27,250 |
2.1% |
18,083,000 |
6,630 |
0.118 |
Auto Parts Stores |


|
QDEL |
QuidelOrtho Corporation |
15 |
- |
$42.68 |
$70,344,000 |
954,466 |
2.1% |
29,319,000 |
392,790 |
1.426 |
Diagnostic Substances |


|
CHD |
Church & Dwight Co Inc |
16 |
- |
$106.78 |
$68,733,000 |
726,870 |
2.05% |
14,345,000 |
133,306 |
0.293 |
Cleaning Products |


|
SBUX |
Starbucks Corp |
17 |
- |
$73.50 |
$65,489,000 |
682,103 |
1.95% |
8,004,000 |
52,263 |
0.058 |
Specialty Eateries |


|
TFX |
Teleflex Inc |
18 |
- |
$200.45 |
$64,296,000 |
257,864 |
1.92% |
51,153,000 |
190,950 |
0.514 |
Conglomerates |


|
AMG |
Affiliated Managers Group Inc |
19 |
- |
$156.77 |
$59,558,000 |
393,330 |
1.78% |
19,588,000 |
86,670 |
0.845 |
Asset Management |


|
PYPL |
Paypal Holdings, Inc. |
20 |
- |
$63.81 |
$57,857,000 |
942,140 |
1.73% |
5,057,000 |
38,950 |
0.081 |
N/A |


|
CG |
The Carlyle Group Inc |
21 |
- |
$31.75 |
$57,800,000 |
1,420,500 |
1.72% |
15,576,000 |
20,500 |
0.407 |
Cigarettes & Other To... |


|
CL |
Colgate Palmolive Co |
24 |
- |
$93.47 |
$51,792,000 |
649,760 |
1.55% |
11,664,000 |
85,450 |
0.076 |
Personal Products |


|
PEP |
Pepsico Inc |
25 |
- |
$177.41 |
$49,902,000 |
293,820 |
1.49% |
6,965,000 |
40,415 |
0.021 |
Beverage Soft Drinks... |


|
ORA |
Ormat Technologies Inc |
28 |
- |
$68.49 |
$39,768,000 |
524,710 |
1.19% |
10,795,000 |
110,330 |
0.937 |
Electric Utilities |


|
NEM |
Newmont Mining Corp |
29 |
- |
$41.54 |
$34,183,000 |
825,880 |
1.02% |
4,013,000 |
9,380 |
0.103 |
Gold |


|
BCE |
BCE Inc (USA) |
32 |
- |
$33.62 |
$29,974,000 |
757,505 |
0.89% |
7,687,000 |
176,375 |
0.084 |
Telecom Services - Do... |


|
ARCC |
Ares Capital Corp |
40 |
- |
$20.78 |
$13,370,000 |
667,500 |
0.4% |
1,104,000 |
37,500 |
0.158 |
Closed - End Fund - Debt |


|
BAM |
Brookfield Asset Management... |
43 |
- |
$39.15 |
$12,251,000 |
303,500 |
0.37% |
5,388,000 |
98,500 |
0.074 |
Asset Management |


|
AHCO |
AdaptHealth Corp |
45 |
- |
$9.69 |
$7,290,000 |
1,000,000 |
0.22% |
2,217,000 |
442,500 |
0.764 |
N/A |


|
NABL |
N-Able, Inc. |
47 |
- |
$12.67 |
$7,023,000 |
530,000 |
0.21% |
1,024,000 |
65,000 |
0.279 |
N/A |


|
MSG |
Madison Square Garden Co |
48 |
- |
$190.70 |
$6,364,000 |
35,000 |
0.19% |
1,516,000 |
7,500 |
0.019 |
N/A |


|
DNB |
Dun & Bradstreet Corp |
51 |
- |
$10.13 |
$5,850,000 |
500,000 |
0.17% |
1,804,000 |
95,000 |
0.118 |
Business Services |


|
WOW |
Wideopenwest, Inc. |
57 |
- |
$4.65 |
$3,686,000 |
910,000 |
0.11% |
-407,000 |
375,000 |
1.048 |
N/A |
|


