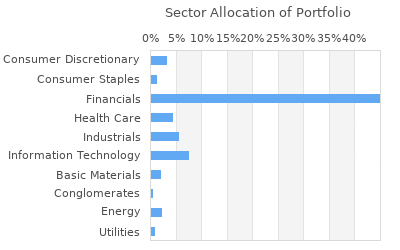
| |
|
|
| Name: |
HUTCHENS INVESTMENT MANAGEMENT INC |
| City: |
CONCORD |
| State: |
NH |
| Zip: |
03301 |
| |
|
|
| Achive
data |
| View
Filing Period: |
|
|
|
|
|

|
 |
Download |
|
|
| |
| |
|
Free Registration Required For Full Results
|
|
|
| Holdings
Found :
28 |
|
View All Holdings |
Currently
Viewing:
Increased Positions |
|
|
Page 1 of 1 |
Menu
 |
Ticker |
Company Name |
Position
Rank |
New/Closed
Postion |
Last
Close |
Value |
Shares Held |
% of
Portfolio |
Value
Change |
Change In
Shares Held |
% of Company |
Industry |


|
XOM |
Exxon Mobil Corp |
1 |
- |
$116.75 |
$4,289,000 |
57,685 |
4.52% |
732,000 |
14,928 |
0.001 |
Integrated Oil & Gas |


|
AGN |
Allergan plc |
2 |
- |
$193.02 |
$3,402,000 |
12,515 |
3.58% |
-390,000 |
20 |
0.003 |
Drug Manufacturers - ... |


|
AAPL |
Apple Inc |
3 |
- |
$181.71 |
$3,246,000 |
29,426 |
3.42% |
101,000 |
4,350 |
0 |
Personal Computers |


|
SBUX |
Starbucks Corp |
4 |
- |
$72.90 |
$3,223,000 |
56,709 |
3.39% |
199,000 |
301 |
0.004 |
Specialty Eateries |


|
SWKS |
Skyworks Solutions Inc |
5 |
- |
$91.78 |
$3,148,000 |
37,386 |
3.32% |
746,000 |
14,311 |
0.02 |
Semiconductor - Integ... |


|
FB |
Meta Platforms Inc |
6 |
- |
$465.68 |
$3,126,000 |
34,775 |
3.29% |
161,000 |
200 |
0.001 |
Internet Service Prov... |


|
ABBV |
Abbvie Inc. |
7 |
- |
$162.73 |
$2,998,000 |
55,102 |
3.16% |
824,000 |
22,752 |
0.003 |
Drug Manufacturers - ... |


|
CELG |
Celgene Corp |
13 |
- |
$108.24 |
$2,437,000 |
22,525 |
2.57% |
-138,000 |
280 |
0.003 |
Drug Manufacturers - ... |


|
NXPI |
NXP Semiconductors NV |
14 |
- |
$259.63 |
$2,405,000 |
27,625 |
2.53% |
787,000 |
11,150 |
0.011 |
Semiconductor- Broad... |


|
CVS |
CVS/Caremark Corp |
15 |
- |
$55.97 |
$2,389,000 |
24,757 |
2.52% |
-66,000 |
1,351 |
0.002 |
Drug Stores |


|
WFC |
Wells Fargo & Co |
16 |
- |
$60.19 |
$2,375,000 |
46,254 |
2.5% |
347,000 |
10,202 |
0.001 |
Domestic Money Center... |


|
TSCO |
Tractor Supply Co |
17 |
- |
$269.54 |
$2,333,000 |
27,665 |
2.46% |
-151,000 |
50 |
0.02 |
Specialty Retail, Other |


|
MS |
Morgan Stanley |
18 |
- |
$94.79 |
$2,215,000 |
70,308 |
2.33% |
-508,000 |
102 |
0.004 |
Investment Brokerage ... |


|
SCHW |
Charles Schwab Corp |
20 |
- |
$76.86 |
$2,151,000 |
75,301 |
2.27% |
-294,000 |
401 |
0.004 |
Investment Brokerage ... |


|
DIS |
Walt Disney Co |
22 |
- |
$116.47 |
$2,095,000 |
20,502 |
2.21% |
-234,000 |
101 |
0.001 |
Entertainment - Diver... |


|
AVGO |
Broadcom Limited |
23 |
- |
$1,310.31 |
$1,966,000 |
15,726 |
2.07% |
-38,000 |
651 |
0.006 |
Semiconductor- Broad... |


|
DLTR |
Dollar Tree Stores Inc |
25 |
- |
$120.18 |
$1,928,000 |
28,925 |
2.03% |
-343,000 |
175 |
0.012 |
Discount, Variety Stores |


|
HCA |
HCA Holdings Inc |
26 |
- |
$310.06 |
$1,855,000 |
23,975 |
1.95% |
-313,000 |
75 |
0.005 |
Hospitals |


|
ABC |
AmerisourceBergen Corp |
27 |
- |
$224.04 |
$1,767,000 |
18,602 |
1.86% |
-198,000 |
125 |
0.008 |
Drugs Wholesale |


|
MCK |
McKesson Corp |
28 |
- |
$531.10 |
$1,710,000 |
9,242 |
1.8% |
-363,000 |
20 |
0.006 |
Drugs Wholesale |


|
ORLY |
O Reilly Automotive Inc |
29 |
- |
$1,016.09 |
$1,679,000 |
6,715 |
1.77% |
549,000 |
1,715 |
0.006 |
Auto Parts Stores |


|
SRLN |
SPDR Blackstone/GSO Senior ... |
31 |
- |
$41.92 |
$1,568,000 |
32,825 |
1.65% |
1,000 |
1,000 |
0.037 |
N/A |


|
REGN |
Regeneron Pharmaceuticals Inc |
37 |
- |
$958.64 |
$1,361,000 |
2,925 |
1.43% |
70,000 |
395 |
0.003 |
Biotechnology |


|
PFF |
iShares S&P U.S. Preferred ... |
39 |
- |
$31.67 |
$1,316,000 |
34,100 |
1.39% |
19,000 |
1,000 |
0.012 |
Closed - End Fund - E... |


|
EFA |
iShares TR MSCI EAFE Indx FD |
41 |
- |
$79.46 |
$1,091,000 |
19,040 |
1.15% |
-92,000 |
400 |
0.002 |
Closed - End Fund - E... |


|
MSFT |
Microsoft Corp |
47 |
- |
$413.54 |
$378,000 |
8,540 |
0.4% |
1,000 |
3 |
0 |
Application Software |


|
SJNK |
Spdr Barclays Capital Short... |
49 |
- |
$24.91 |
$299,000 |
11,100 |
0.31% |
7,000 |
1,000 |
0.008 |
N/A |


|
EEM |
iShares MSCI Emrg Mkt Income |
54 |
- |
$42.51 |
$239,000 |
7,300 |
0.25% |
29,000 |
2,000 |
0 |
Closed - End Fund - E... |
|


