Sign in:
Email
 Password  save:
  
 Company Reports 
 
   
My Recent Searches
  Help


Today's Summary Breakdown - Sells Explanation  
 
 
   Get market summaries emailed to you up to 3 times daily :  Free Registration   
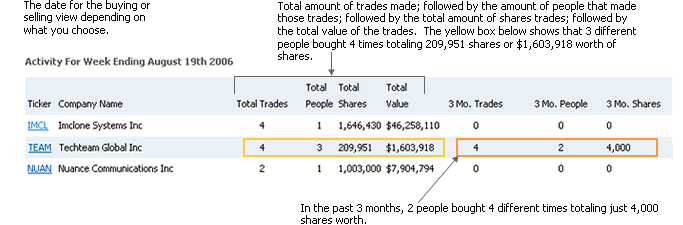
Below are today's Form 4 insiderselling transaction data filed with the SEC (Securities & Exchange Commission, www.sec.gov).  Transactions are grouped by company showing the amount of insiders and combined transaction data.  Also represented within each group is the company's transaction summary history for the last 3 month.  Data will show how many insiders, the total amount of transactions that occurred, the amount of combined shares sold and the combined shares market value.  Insider transaction data is updated every 0-5 min Monday - Friday.  The Form 3 (Initial Ownership Statement), Form 4 (Change in Ownership) and form 5 (Insider who has at least one transaction which was not reported during the year) are also sent in our daily summary emails.

Activity For January 15th 2026
  Download  
     Menu
Ticker Company Name Total Trades Total People Total   Shares Total Value 3 Mo. Trades 3 Mo. People 3 Mo. Shares
   (RDW)1 Year Chart         RDW Genesis Park Acquisition Corp. 2 2 14,319,167 $150,273,690 5 3 68,913
   (PBF)1 Year Chart         PBF PBF Energy Inc 2 1 366,000 $12,199,207 0 0 0
   (JBL)1 Year Chart         JBL Jabil Circuit Inc 5 2 23,800 $5,761,417 0 0 0
   (SRRK)1 Year Chart         SRRK Scholar Rock Holding Corp 4 4 111,389 $4,756,311 0 0 0
   (URBN)1 Year Chart         URBN Urban Outfitters Inc 6 2 58,666 $4,210,848 0 0 0
   (FIVE)1 Year Chart         FIVE Five Below, Inc 3 2 15,525 $3,135,573 0 0 0
   (OLMA)1 Year Chart         OLMA Olema Pharmaceuticals, Inc. 2 1 103,822 $2,980,054 0 0 0
   (AIR)1 Year Chart         AIR AAR Corp 2 1 26,749 $2,650,941 0 0 0
   (VRSN)1 Year Chart         VRSN Verisign Inc 3 1 9,000 $2,236,082 0 0 0
   (PNRG)1 Year Chart         PNRG Primeenergy Corp 1 1 8,700 $1,590,778 0 0 0
   (MEGI)1 Year Chart         MEGI Mainstay Cbre Global Infrastructure Megatrends Fund 2 1 110,906 $1,525,546 0 0 0
   (COST)1 Year Chart         COST Costco Wholesale Corp 1 1 1,500 $1,408,500 0 0 0
   (ECAT)1 Year Chart         ECAT Blackrock Esg Capital Allocation Trust 2 1 86,866 $1,380,636 0 0 0
   (QBTS)1 Year Chart         QBTS D-Wave Quantum Inc. 2 2 44,192 $1,240,129 1 1 82
   (RH)1 Year Chart         RH Restoration Hardware Holdings Inc 2 1 4,254 $936,080 0 0 0
   (CRM)1 Year Chart         CRM Salesforce.com Inc 1 1 3,893 $929,276 2 2 97,936
   (IIF)1 Year Chart         IIF Morgan Stanley Dean Witter India Investment 1 1 29,465 $720,714 0 0 0
   (APLS)1 Year Chart         APLS Apellis Pharmaceuticals Inc 7 7 27,370 $607,263 0 0 0
   (CRDO)1 Year Chart         CRDO Credo Technology Group Holding Ltd 1 1 2,200 $350,196 0 0 0
   (PLAB)1 Year Chart         PLAB Photronics Inc 1 1 10,000 $344,200 0 0 0
   (SAFX)1 Year Chart         SAFX Xcf Global Class A 2 1 1,561,363 $249,745 0 0 0
   (STSS)1 Year Chart         STSS Sharps Technology Inc. 2 1 107,465 $240,010 0 0 0
   (EVCM)1 Year Chart         EVCM Evercommerce Inc. 2 1 19,200 $227,443 0 0 0
   (GOOG)1 Year Chart         GOOG Alphabet Inc 1 1 600 $202,514 0 0 0
   (ACRE)1 Year Chart         ACRE Ares Commercial Real Estate Corp 3 3 35,585 $175,349 0 0 0
   (AEO)1 Year Chart         AEO American Eagle Outfitters Inc 1 1 1,896 $49,702 0 0 0
   (VEL)1 Year Chart         VEL Velocity Financial, Llc 1 1 1,573 $30,687 0 0 0
   (USIO)1 Year Chart         USIO Usio Ord Shs 2 1 7,520 $10,272 0 0 0
   (USUN)1 Year Chart         USUN Ultra Sun Corp 2 1 206,300 $3,920 0 0 0


  Transaction Code Key: Ownership Code Key
  B - Buy AB - Automatic Buy D - Direct Ownership
  S - Sell AS - Automatic Sell I - Indirect Ownership
  OE - Options Exercised A - Acquired
  IO - Initital Ownership D - Disposed