| |
| |
|
|
| Last Closing Day Summary - Sells |
 |
Explanation |
|
| |
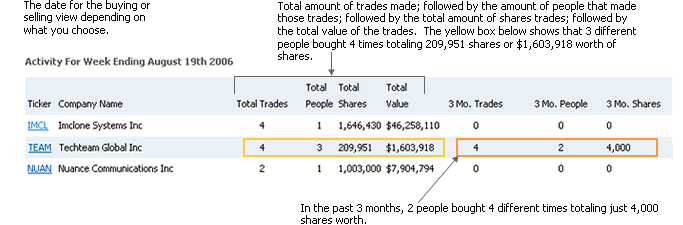
Below are today's Form 4 insider selling
transaction data filed with the SEC (Securities & Exchange
Commission, www.sec.gov). Transactions are grouped
by company showing the amount of insiders and combined transaction
data. Also represented within each group is the company's
transaction summary history for the last 3 month. Data
will show how many insiders, the total amount of transactions
that occurred, the amount of combined shares sold and the combined
shares market value. Insider transaction data is
updated every 0-5 min Monday - Friday. The Form 3 (Initial
Ownership Statement), Form 4 (Change in Ownership) and form
5 (Insider who has at least one transaction which was not reported
during the year) are also sent in our daily summary emails. |
|
|
|
|
 |
Download |
|
Menu
 |
Ticker |
Company Name |
Total Trades |
Total People |
Total Shares |
Total Value |
3 Mo. Trades |
3 Mo. People |
3 Mo. Shares |


|
ROIV |
Roivant Sciences Ltd. |
9 |
3 |
3,677,352 |
$97,975,554 |
0 |
0 |
0 |
|
|
APH |
Amphenol Corp |
2 |
1 |
608,333 |
$89,577,564 |
1 |
1 |
10,000 |
|
|
RCL |
Royal Caribbean Cruises Ltd |
4 |
4 |
226,483 |
$74,052,286 |
0 |
0 |
0 |
|
|
PG |
Procter & Gamble Co |
4 |
3 |
222,188 |
$36,035,410 |
0 |
0 |
0 |
|
|
APD |
Air Products & Chemicals Inc |
1 |
1 |
70,175 |
$19,944,437 |
0 |
0 |
0 |
|
|
C |
Citigroup Inc |
6 |
5 |
151,838 |
$17,397,955 |
0 |
0 |
0 |
|
|
PBF |
PBF Energy Inc |
2 |
1 |
453,000 |
$16,030,978 |
0 |
0 |
0 |
|
|
GS |
Goldman Sachs Group Inc |
2 |
1 |
15,855 |
$15,210,754 |
0 |
0 |
0 |
|
|
POWL |
Powell Industries Inc |
2 |
1 |
25,196 |
$15,054,877 |
0 |
0 |
0 |
|
|
PH |
Parker Hannifin Corp |
3 |
3 |
11,432 |
$11,416,442 |
0 |
0 |
0 |
|
|
CAT |
Caterpillar Inc |
2 |
2 |
14,197 |
$10,906,493 |
0 |
0 |
0 |
|
|
CMI |
Cummins Inc |
1 |
1 |
18,107 |
$10,811,646 |
0 |
0 |
0 |
|
|
BW |
Babcock & Wilcox Enterprises, Inc. |
1 |
1 |
1,155,382 |
$10,398,438 |
0 |
0 |
0 |
|
|
CCS |
Century Communities, Inc. |
1 |
1 |
100,100 |
$7,251,225 |
0 |
0 |
0 |
|
|
FITB |
Fifth Third Bancorp |
2 |
1 |
97,516 |
$5,203,266 |
0 |
0 |
0 |
|
|
RTX |
RTX Corp |
2 |
2 |
25,663 |
$5,128,491 |
0 |
0 |
0 |
|
|
CL |
Colgate Palmolive Co |
2 |
1 |
50,000 |
$4,778,437 |
0 |
0 |
0 |
|
|
ACGL |
Arch Capital Group Ltd |
1 |
1 |
47,430 |
$4,558,858 |
0 |
0 |
0 |
|
|
OTIS |
Otis Worldwide Corp |
1 |
1 |
47,944 |
$4,423,059 |
0 |
0 |
0 |
|
|
ETN |
Eaton Corp |
1 |
1 |
10,707 |
$4,178,495 |
1 |
1 |
200 |
|
|
MKC |
McCormick & Co Inc |
1 |
1 |
50,000 |
$3,581,500 |
0 |
0 |
0 |
|
|
MHO |
M I Schottenstein Homes Inc |
2 |
2 |
23,590 |
$3,463,083 |
0 |
0 |
0 |
|
|
SYM |
Symbotic Inc |
1 |
1 |
60,000 |
$3,450,421 |
0 |
0 |
0 |
|
|
SMG |
The Scotts Miracle-Gro Co |
1 |
1 |
50,000 |
$3,319,935 |
0 |
0 |
0 |
|
|
HAS |
Hasbro Inc |
3 |
3 |
29,957 |
$3,128,395 |
0 |
0 |
0 |
|
| |
Transaction
Code Key: |
Ownership
Code Key |
| |
B |
- Buy |
AB |
- Automatic
Buy |
D |
- Direct Ownership |
| |
S |
- Sell |
AS |
- Automatic
Sell |
I |
- Indirect
Ownership |
| |
OE |
- Options
Exercised |
A |
- Acquired |
| |
IO |
- Initital
Ownership |
D |
- Disposed |
| |
|
|
|
|
|
|
|