

|
|
What we do |
|
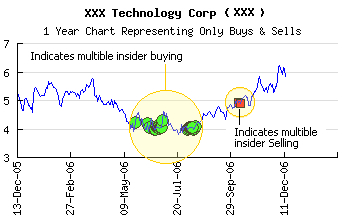
In this example a Director and 10 percent owner purchased stock for a total value of $6.6 million through 67 transactions during a 4 month period. The information about the buyer and the amounts were taken from the company summary which we will get to shortly. |
|
Copyright © 2010 j3sg.com | Information provided
is for demonstration purposes only.